 Buy $GGs
Bitcoin Price Prediction: Technical Indicator Hints Strength in BTC Price


A support fallout from a flag pattern suggests further correction in Bitcoin(BTC) price. The successful retest validates this breakdown, followed by a 4% decline in price. Responding to the pattern fallout, the coin price could hit $36650 and, with sustained selling, the $30000 mark.
Key points on BTC analysis:
- The BTC price give witnessed a 9% fall within a fortnight
- An upside breakout from the $40000 resistance would invalidate the bearish theory
- The intraday trading volume in the Bitcoin is $27.3 Billion, indicating a 3.2% gain
 Source- Tradingview
On April 22nd, the Bitcoin(BTC) price gave a bearish breakout from a four-month-old flag pattern. Amid the pattern fallout, the coin holders lost the $40000 psychological support, intensifying the ongoing correction.
After spending a week retesting these breached support levels, the BTC price continues to decline to reach its current value of $37909.
The sustained selling would hit the near support of $36650, and the following breakdown would sink the coin to January bottom support at $30000.
Any unexpected pullback needs to overcome the descending trendline and $40000 to provide a recovery sign.
NVT Ration hints Bitcoin(BTC) is undervalued
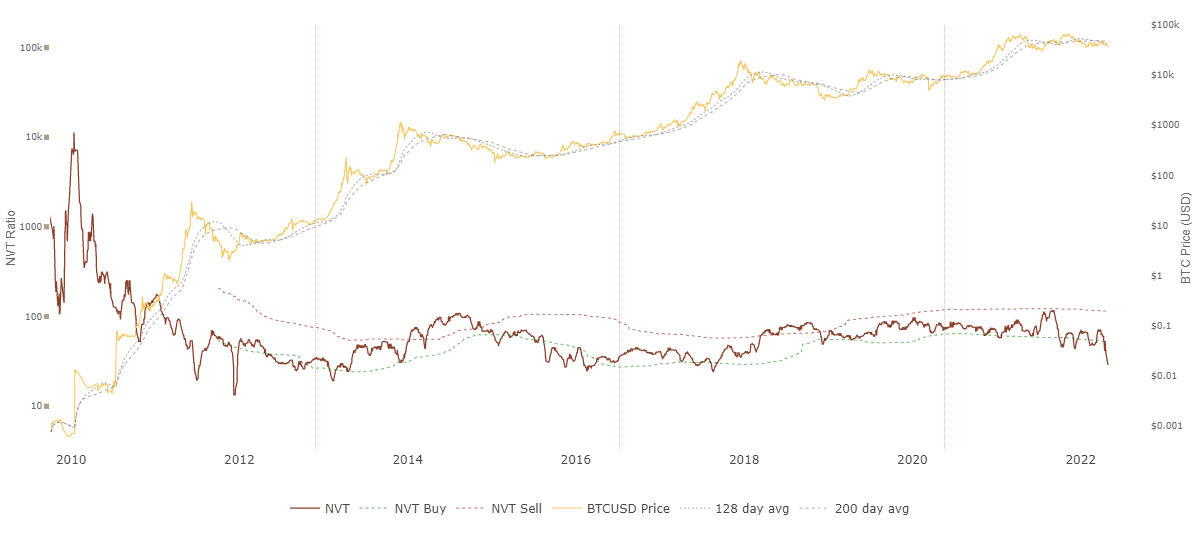
The Network Value to Transactions (NVT) Ratio created by Willy Woo indicates the relation between market capitalization and transfer volume. It is calculated by dividing market cap(USD) by daily transfer volume(USD).
A high NVT value indicates the Market Cap growth exceeds the transaction volume, suggesting the BTC price is trading at a premium or overvalued.
Conversely, a low NVT value is considered the coin price is trading at a discount or undervalued.
The current value of the NVT ratio is near 26(undervalued), a level last seen in early 2016 and late 2017, which triggered a significant upward move.
Technical indicator-
Despite descending price action, the RSI slope forming a higher low suggests losing bearish momentum. This bullish divergence gives the price to rebound in the near future.
A slight down curve in crucial EMAs(20,50, 100, and 200) suggests bears have the upper hand in the overall sideways rally. Moreover, the 20-day EMA offers constant resistance to the BTC price.
- Resistance level- $40000, $42350
- Support level- $36650, $33000
Play 10,000+ Casino Games at BC Game with Ease
- Instant Deposits And Withdrawals
- Crypto Casino And Sports Betting
- Exclusive Bonuses And Rewards


Why Trust CoinGape
CoinGape has covered the cryptocurrency industry since 2017, aiming to provide informative insights Read more…to our readers. Our journal analysts bring years of experience in market analysis and blockchain technology to ensure factual accuracy and balanced reporting. By following our Editorial Policy, our writers verify every source, fact-check each story, rely on reputable sources, and attribute quotes and media correctly. We also follow a rigorous Review Methodology when evaluating exchanges and tools. From emerging blockchain projects and coin launches to industry events and technical developments, we cover all facets of the digital asset space with unwavering commitment to timely, relevant information.

Related Articles


- Is the Bitcoin Price Correction Really Over or Is This a Bear Market Trap?
- ‘Gambling Is Not Investing’: New Group Pushes Crackdown on Prediction Markets
- XRP News: Ripple Prime to Move Post-Trade Activity to XRPL via NSCC Link
- Fed Rate Cut at Risk: Janet Yellen Flags Inflation Concerns Amid US-Iran War
- Senate Eyes CLARITY Act Markup This Month as Banks, Crypto Continue Stablecoin Yield Talks
- Top 5 Historical Reasons Dogecoin Price Is Not Rising
- Pi Coin Price Prediction for March 2026 Amid Network Upgrade, KYC Boost, Rewards Distribution
- Gold Price Nears ATH; Silver Eyes $100 Breakout on Us- Iran War
- Bitcoin And XRP Price As US Kills Iran Supreme Leader- Is A Crypto Crash Ahead?
- Gold Price Prediction 2026: Analysts Expect Gold to Reach $6,300 This Year
- Circle (CRCL) Stock Price Prediction as Today is the CLARITY Act Deadline


