Bitcoin Price Support Near $19,800 Aided Recovery; Are Gains Sustainable?


In our previous Bitcoin price analysis, we find out a strong support level placed near $19,800. In the short-term time frame, the bulls defended the key level and managed to hold $20,000.
Now, the question is whether the upside is sustainable or it’s just a bull trap.
- Bitcoin price trades in a very tight range with a neutral bias.
- On the daily chart, the bullish pattern invokes upside momentum hope.
- However, a reversal cannot be ruled out below $19,800.
Bitcoin price stabilizes near $20,000
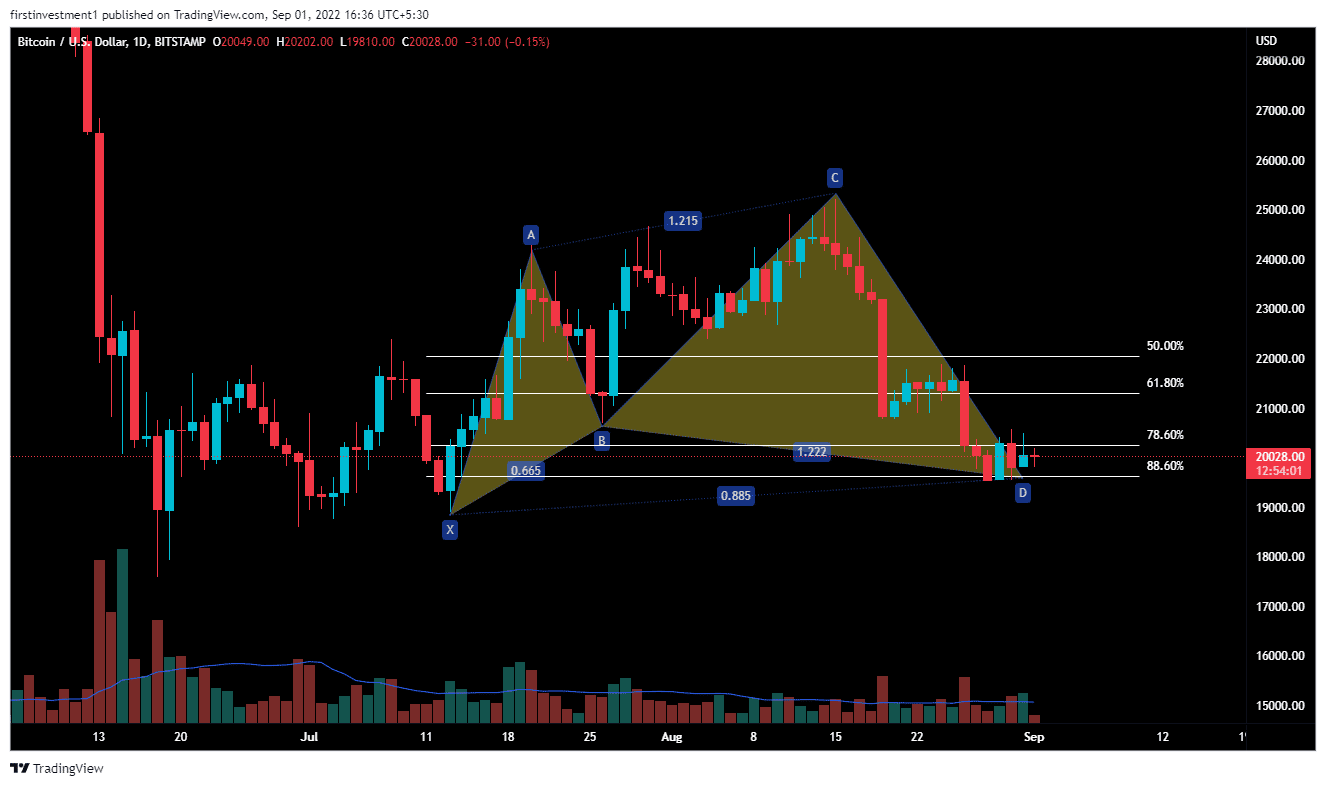
On the daily chart, BTC formed a “Bullish Shark” harmonic pattern. In a bullish Shark formation, the second top is higher than the first one. Further, it combines Fibonacci with Elliott’s waves theory, and some new ratios like 88.6% are used. Along with this bullish pattern, the price hasn’t broken its previous swing low as well, indicating a possible reversal in the short term.
According to this pattern, If the price closes above a strong bearish candle, tested the 88.6% Fib. level ($20,320), then we can expect a bullish movement of up to ($22,400). The conclusion is that the price is still bearish, and has a possibility to go down even more in the future to its recent swing low. However, if additional buying could sustain ($19,800) this week, then we can expect a reversal in the coming weeks.
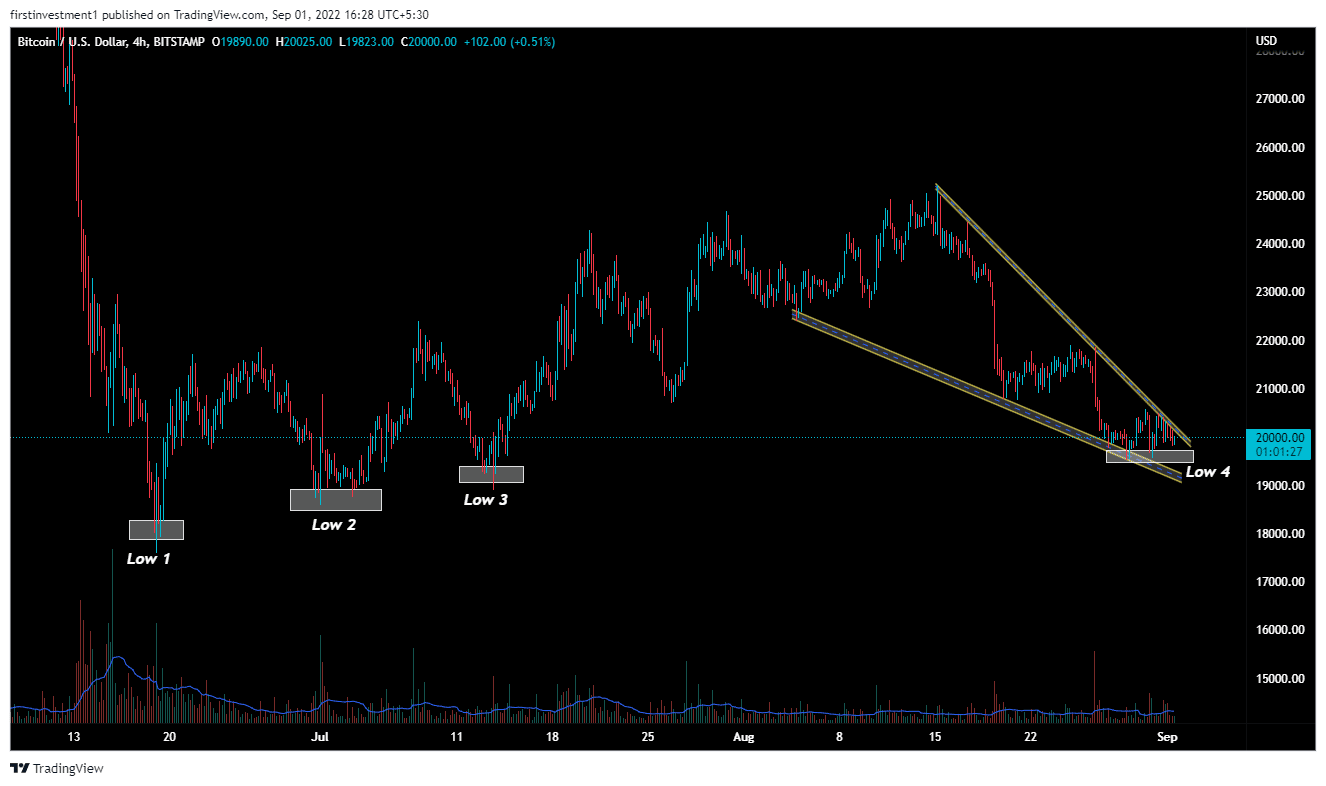
Bitcoin price analysis on the 4-hour chart shows the formation of a “Falling Wedge” pattern. The falling wedge can be one of the most difficult chart patterns to accurately recognize and trade.
When lower highs and lower lows form, as in a falling wedge, security remains in a downtrend. The falling wedge is designed to spot a decrease in downside momentum and alert technicians to a potential trend reversal.
The price even formed a “Double Bottom” pattern, on the support levels, indicating bullishness.
The nearest support is ($19,800), whereas the nearest resistance is around ($20,400). There is a higher probability of the price breaking its resistance. But, if any chance price tends to come close to its support, and we’ve seen any rejection there with rising volumes, then we can still deploy the “Buy on dips” strategy.
On the other hand, a break below the $19,800 level could invalidate the bullish outlook. And the price can drag toward $19,300.
Bitcoin price is slightly mixed to mildly bullish on all time frames. Above $20,200 closing on the hourly time frame, we can put a trade on the buy side.
As of writing, BTC/USD is trading at $20,098, down 0.22% for the day.

Why Trust CoinGape
CoinGape has covered the cryptocurrency industry since 2017, aiming to provide informative insights Read more…to our readers. Our journal analysts bring years of experience in market analysis and blockchain technology to ensure factual accuracy and balanced reporting. By following our Editorial Policy, our writers verify every source, fact-check each story, rely on reputable sources, and attribute quotes and media correctly. We also follow a rigorous Review Methodology when evaluating exchanges and tools. From emerging blockchain projects and coin launches to industry events and technical developments, we cover all facets of the digital asset space with unwavering commitment to timely, relevant information.

Related Articles


- CryptoQuant Flags $54K Bitcoin Risk As Trump Considers Limited Strike On Iran
- Why Is Bitdeer Stock Price Dropping Today?
- Breaking: U.S. Supreme Court Strikes Down Trump Tariffs, BTC Price Rises
- Breaking: U.S. PCE Inflation Rises To 2.9% YoY, Bitcoin Falls
- BlackRock Signals $270M Bitcoin, Ethereum Sell-Off as $2.4B in Crypto Options Expire
- Ethereum Price Rises After SCOTUS Ruling: Here’s Why a Drop to $1,500 is Possible
- Will Pi Network Price See a Surge After the Mainnet Launch Anniversary?
- Bitcoin and XRP Price Prediction As White House Sets March 1st Deadline to Advance Clarity Act
- Top 3 Price Predictions Feb 2026 for Solana, Bitcoin, Pi Network as Odds of Trump Attacking Iran Rise
- Cardano Price Prediction Feb 2026 as Coinbase Accepts ADA as Loan Collateral
- Ripple Prediction: Will Arizona XRP Reserve Boost Price?


