Bitcoin Price: What’s Next For BTC After Fed Chair Jerome Powell’s Speech?


Highlights
- Bitcoin shows renewed strength as indicators align with a broader recovery trend.
- Technical indicators improves as buyers target higher reclaim zones on the chart.
- Liquidity expansion and QT ending support stronger market confidence across crypto.
Bitcoin price extended its recent recovery today after an 8% surge lifted the market above $90,000. The relocation created a firmer grip in an area that was previously of great interest on both sides of the market. Price is now nearing a critical area which frequently determines whether temporary gains are to be converted to long-term progress.
Meanwhile, buyers show renewed confidence after last week’s setback. The present gain puts Bitcoin in a potential drive towards greater heights in case this framework is not destroyed within the next few sessions.
Bitcoin Price Technical Analysis Shows 100K Path Opening
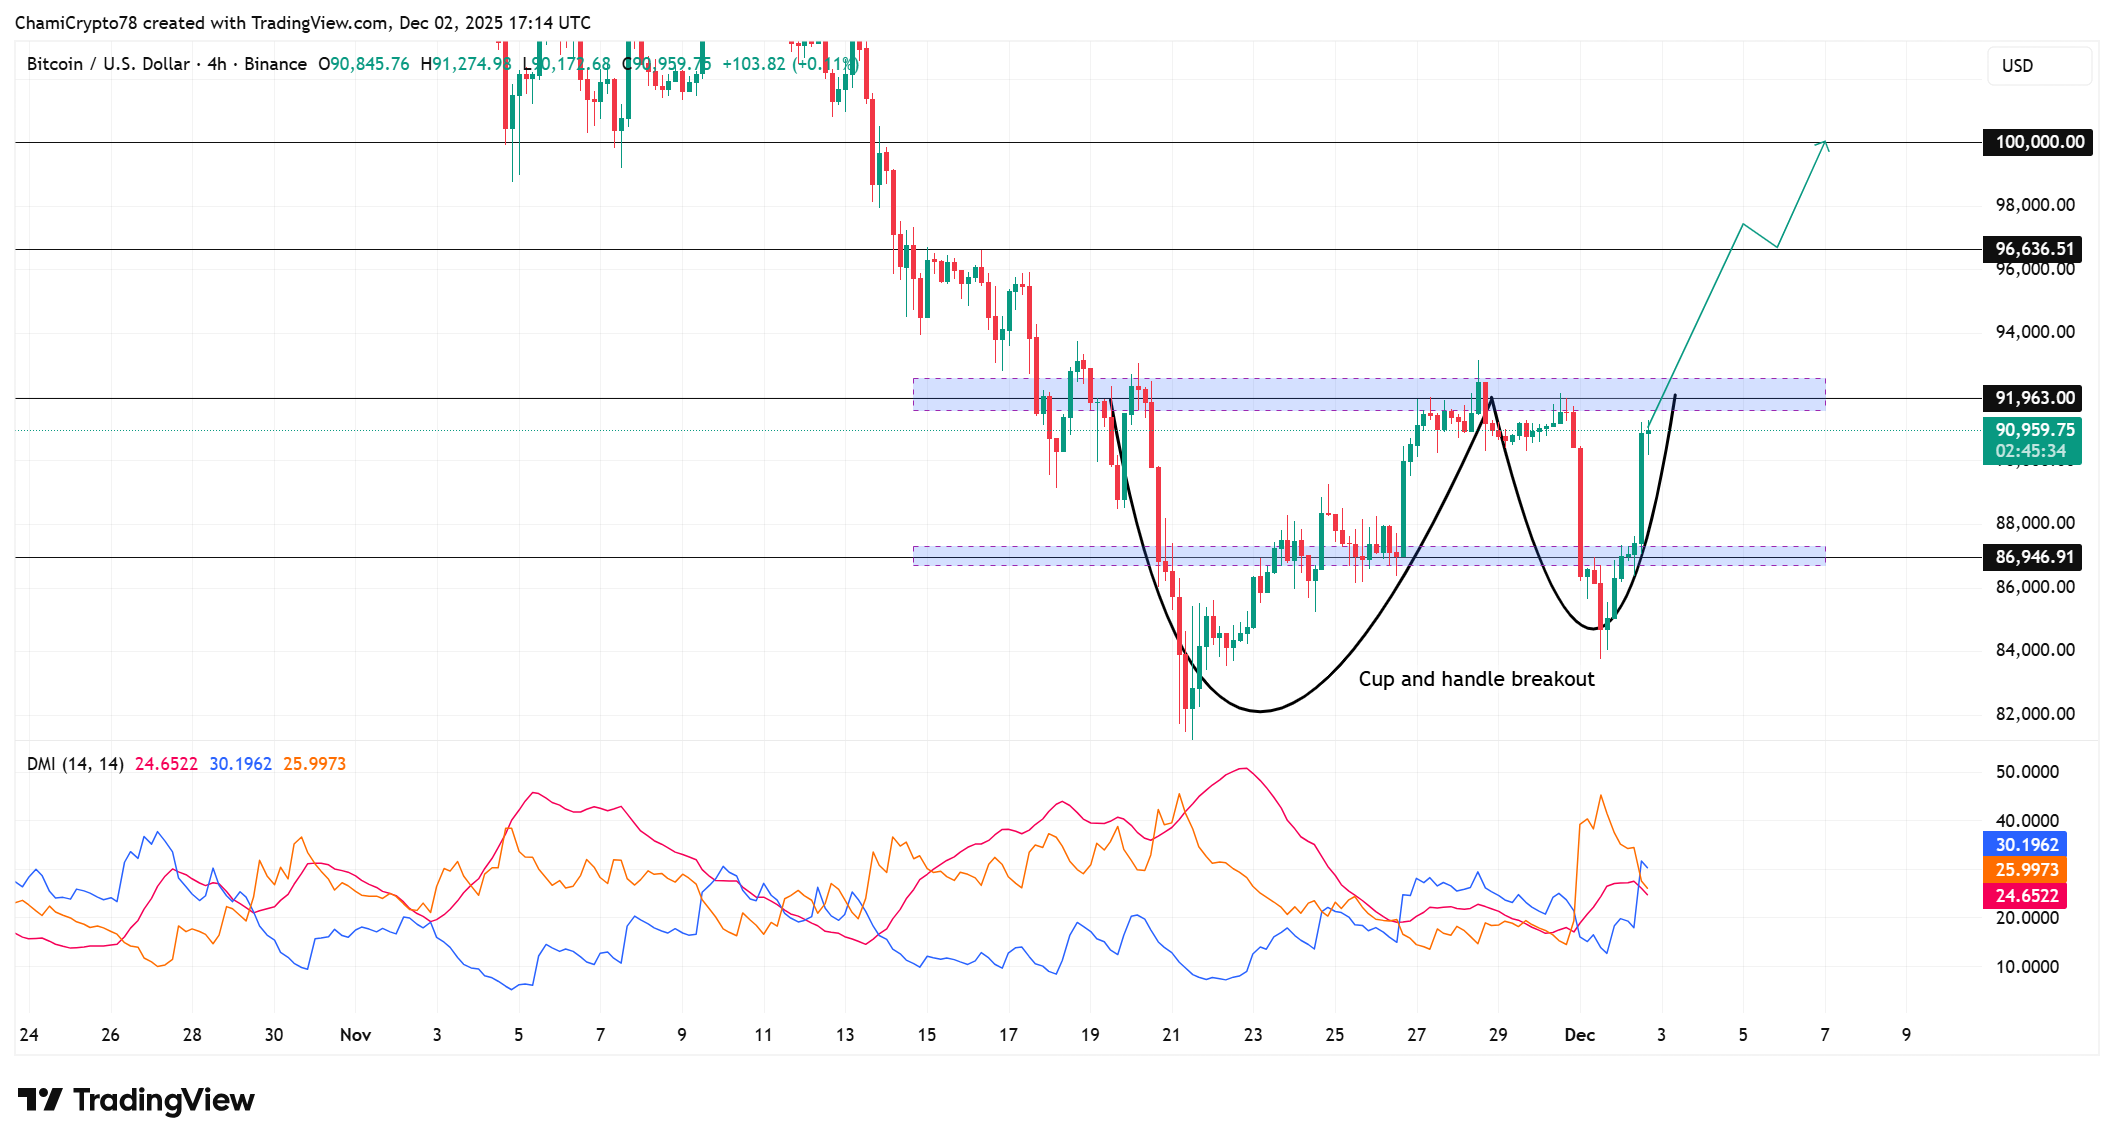
At the time of writing, Bitcoin value is trading at $90,959 following a clear wave that regained the mid-range. The BTC price chart reveals a clean cup-and-handle pattern, and that structure signals a path toward higher targets.
Notably, the neckline is at $91,963 and it is currently the point of entry into long term growth. Price also recovered strongly at the level of $86,946 and that indicates that the price is at least holding at the present levels. The second reaction point is created around the $96,636 and a solid close above this area increases the run to the 100K mark.
Besides, the DMI indicator now shows clear improvement as +DI moves firmly above -DI. This movement indicates greater directional purpose and proves the fact that the buyers are in charge of the present stage.
Besides, the ADX prints above 24 and strengthens the trend quality behind this advance. The reading reveals that the market is now backing a growing trend and not short bursts. These indicators combined with each other confirm a breakout attempt and strengthen the direction towards the 100K area.
Meanwhile, repeated higher lows reinforce the handle formation. Every dip is now recovering fast and that is a positive underlying interest. BTC price therefore enters a zone that supports a breakout continuation. In case the neckline and upper resistance cluster are cleared by price, Bitcoin is on a clean road to the 100K reclaim attempt.
Are Technical Indicators Supporting BTC Price Rebound?
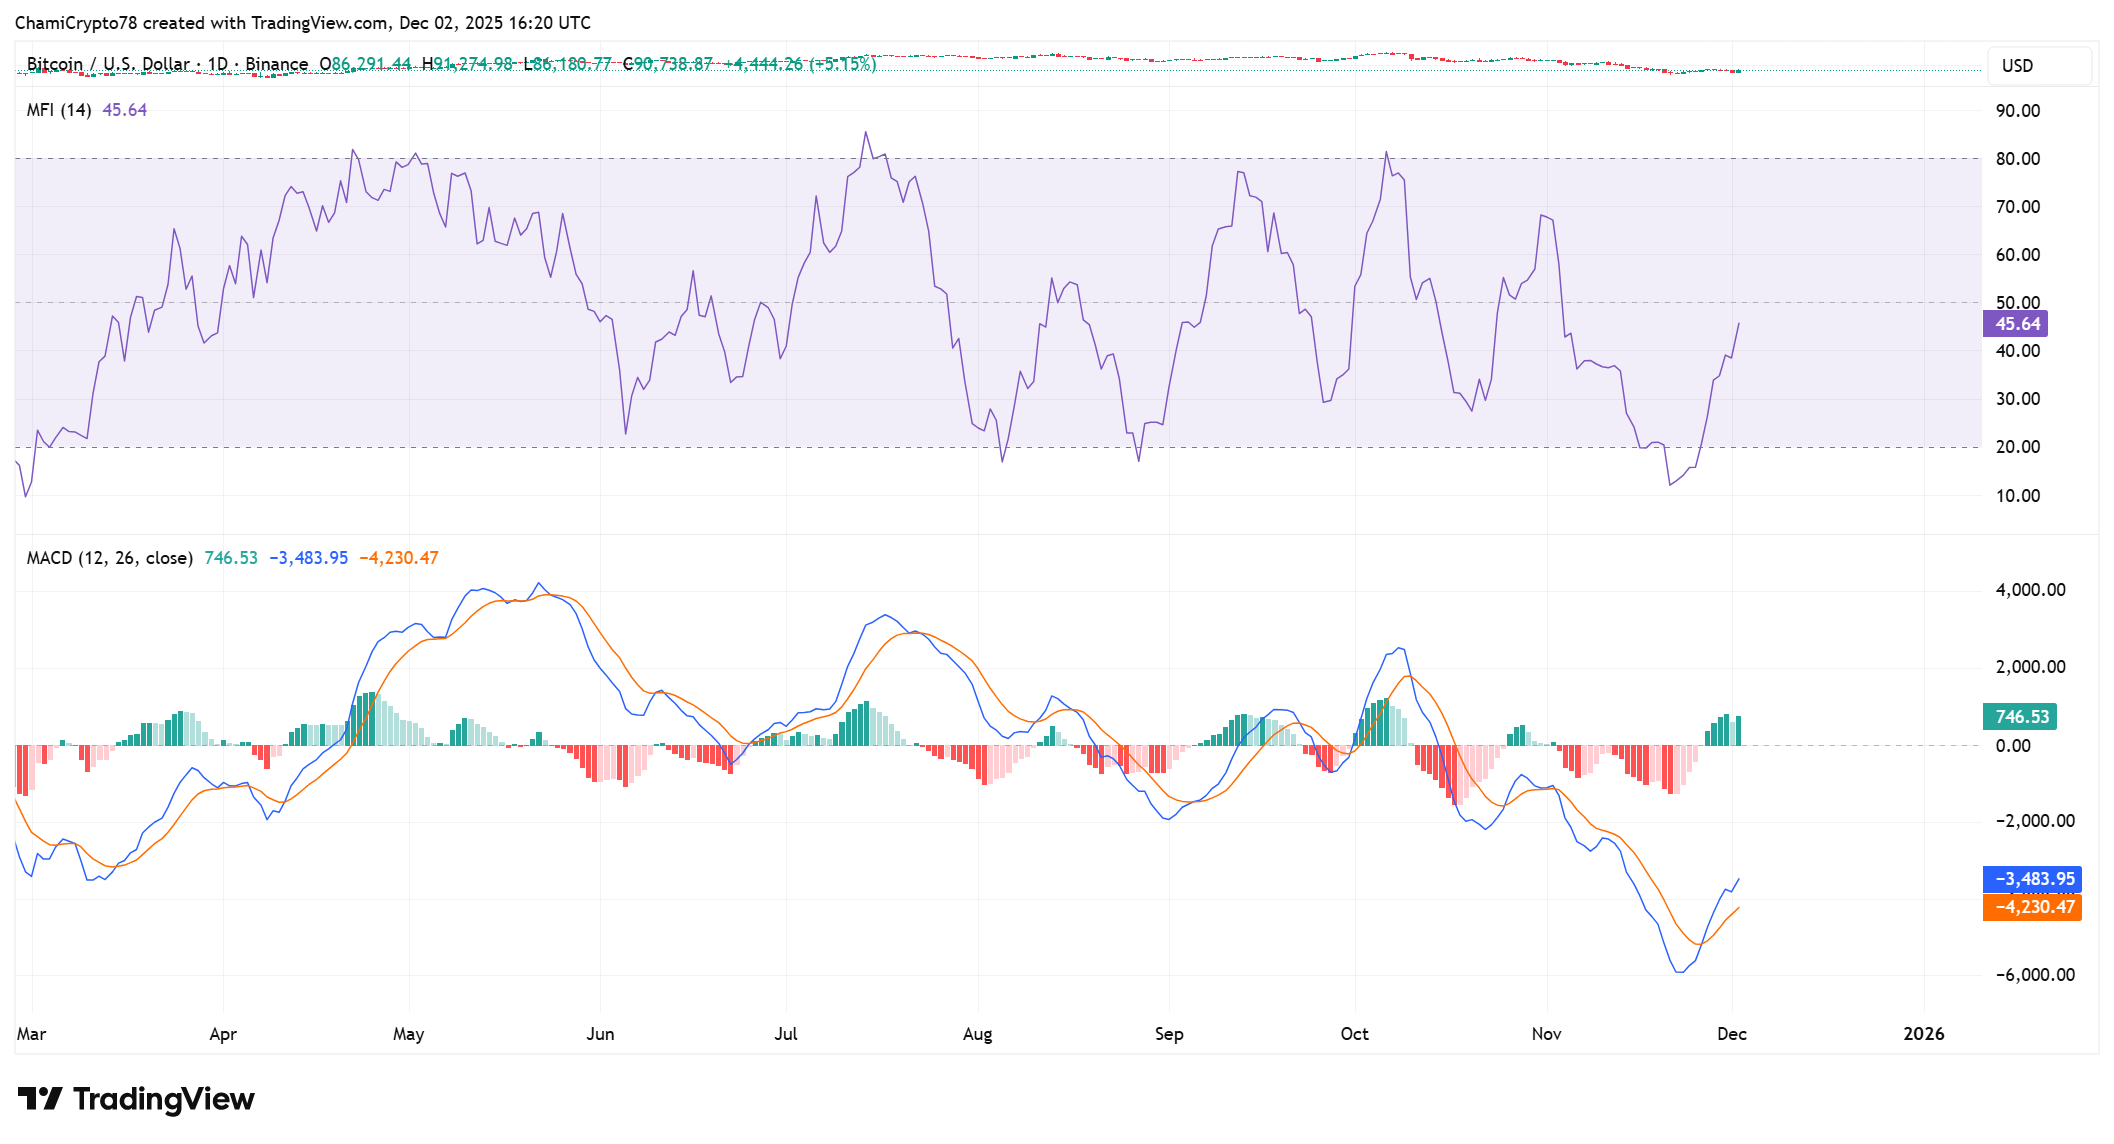
Absolutely. The MFI is currently at almost 45.64 and is rising steadily with a consistent strength following the steep fall last week. The curve indicates regulated inflow pressure and that proves new demand throughout the short term window.
Every intraday low brings in new purchase and that strengthens the recovery theme throughout the chart. The MFI therefore signals healthy participation as Bitcoin pushes toward higher levels.
Meanwhile, the MACD turns upward and prints a clean crossover above the signal line. The histogram bars are growing steadily and that is an indication of strength building behind this progress. The slope of the curve is also steep and that indicates gradual acceleration after the lows in the recent past.
Ultimately, both indicators now align with the broader uptrend and strengthen confidence in the recovery. However, Bitcoin still faces layered resistance zones. If both indicators maintain this pace, BTC price gains meaningful support for a drive toward the 100K region, strengthening the long-term BTC price forecast.
Jerome Powell’s Speech And QT Shift Strengthen Bitcoin’s Climb
Jerome Powell avoided economic commentary during the Stanford appearance, but markets reacted with a clear tilt toward risk assets. His silence came in the FOMC blackout period and that lessened policy friction in the key markets.
Meanwhile, the planned end of QT aligns with a major liquidity jump after the US FED injected $13.5 billion through an overnight repo operation. It was one of the biggest injections in the recent years and an indication of alleviation of financial strain. This mix enhances the situation of Bitcoin and a few leading meme coins.
The BTC price reaction shows clean alignment with this environment. Liquidity increases and policy communication remains constant gives buyers confidence. The positioning helps to sustain the momentum of the recent boom and reinforces the course towards the 100K reclaim. Should Bitcoin overcome the significant resistance at $96,636, the market will have a broader runway to the same.
Summary
Bitcoin is currently at a stage that is supportive of a decisive upsurge. The BTC price structure supports continued strength as the cup-and-handle pattern matures.
Additionally, indicators show improving alignment, and macro conditions now support this advance. Once Bitcoin breaks through the major resistance levels, a reclaim of the 100K level will become more of a possibility than an expectation.
Frequently Asked Questions (FAQs)
1. Why do MFI and MACD matter in Bitcoin analysis?
2. How does Powell’s silence affect market sentiment?
3. What does the end of QT mean for Bitcoin?

Why Trust CoinGape
CoinGape has covered the cryptocurrency industry since 2017, aiming to provide informative insights Read more…to our readers. Our journal analysts bring years of experience in market analysis and blockchain technology to ensure factual accuracy and balanced reporting. By following our Editorial Policy, our writers verify every source, fact-check each story, rely on reputable sources, and attribute quotes and media correctly. We also follow a rigorous Review Methodology when evaluating exchanges and tools. From emerging blockchain projects and coin launches to industry events and technical developments, we cover all facets of the digital asset space with unwavering commitment to timely, relevant information.
24 Hours volume
$18.74B
Market Cap
$1.32T
Max Supply
21M