BNB Price Analysis: Dip to $200 Perfect Buy or a Bearish Act in Play?


The Binance coin has been in aggressive correction mode since August’s second week. From a high of $248, the coin’s market value tumbled 16.7% and reached the current trading price of $206. This high momentum breakdown has recently breached the monthly support of $200, indicating that crypto holders may witness further downfall. Should you sell on this?
Also Read: Venus Protocol Faces Binance Coin (BNB) Liquidation Risk
Binance Coin Daily Chart: Key Points
- The $220 support breakdown sets altcoin for a 10% drop
- A bullish breakout from the overhead resistance will signal a change in market sentiment.
- The intraday trading volume in the BNB coin is $545.4 Million, indicating a 30% loss
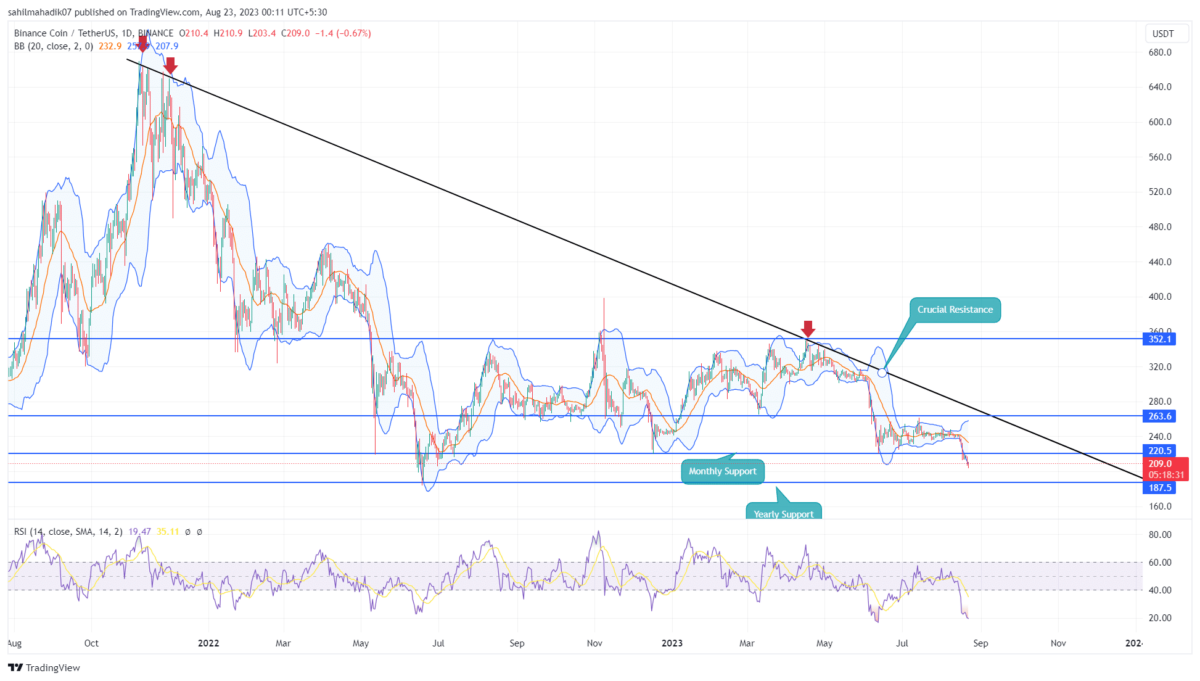
 Source- Tradingview
Amid increasing bearishness in the crypto market, the BNB price gave a massive breakdown from the $220 support on August 17th. After a minor retest phase, the coin price tumbled 6.7% in the last three days and currently exchange hands at $206.
However, the daily time frame chart shows no significant support before the $200 level indicating the BNB price posed for another 10%. The buyers will retest this support after a year and should provide a strong footing for potential investors.
While the selling momentum is aggressive it’s too early to expect a reversal from the aforementioned support. However, for interested traders, a better confirmation for a recovery rally or trend reversal would be a breakout from the overhead trendline.
Can Binance Coin Recovery Back to 350?
The daily time frame chart, a descending trendline has marked the current correction trend in BNB price. The altcoin has turned down thrice from the resistance trendline indicating the traders are aggressively following selling at bullish bounces. Thus a bullish breakout from the barrel could bolster buyers for the first $350
- Bollinger Band: The BNB price challenging the lower band Bollinger Band indicator reflects high momentum selling among trades.
- Relative Strength Index: The daily RSI slope at the oversold region indicates a high possibility for a bullish reversal.

Why Trust CoinGape
CoinGape has covered the cryptocurrency industry since 2017, aiming to provide informative insights Read more…to our readers. Our journal analysts bring years of experience in market analysis and blockchain technology to ensure factual accuracy and balanced reporting. By following our Editorial Policy, our writers verify every source, fact-check each story, rely on reputable sources, and attribute quotes and media correctly. We also follow a rigorous Review Methodology when evaluating exchanges and tools. From emerging blockchain projects and coin launches to industry events and technical developments, we cover all facets of the digital asset space with unwavering commitment to timely, relevant information.

Related Articles


- XRP Sees Largest Realized Loss Since 2022, History Points to Bullish Price Run: Report
- US Strike on Iran Possible Within Hours: Crypto Market on High Alert
- MetaSpace Will Take Its Top Web3 Gamers to Free Dubai Trip
- XRP Seller Susquehanna Confirms Long-Term Commitment to Bitcoin ETF and GBTC
- Vitalik Buterin Offloads $3.67M in ETH Amid Ethereum Price Decline
- Top 4 Reasons Why Bitcoin Price Will Crash to $60k This Week
- COIN Stock Price Prediction: Will Coinbase Crash or Rally in Feb 2026?
- Shiba Inu Price Feb 2026: Will SHIB Rise Soon?
- Pi Network Price Prediction: How High Can Pi Coin Go?
- Dogecoin Price Prediction Feb 2026: Will DOGE Break $0.20 This month?
- XRP Price Prediction As SBI Introduces Tokenized Bonds With Crypto Rewards


