 Buy $GGs
Bone ShibaSwap Price Analysis: Will $BONE Price Recovery Rally Reach $2 Milestone?


Bone ShibaSwap Price Analysis: The Bone ShibaSwap token, associated with the Shiba Inu layer-2 blockchain Shibarium, has experienced a significant surge of over 110%, since last month. This surge came following an announcement made by the lead developer, Shytoshi Kusama, who revealed that the Shibarium mainnet release and the unveiling of the ecosystem’s Worldpaper are scheduled for August. Though this news-driven rally has brought the recovery sentiment back to BONE price, can buyers maintain trend control in the long run?
Also Read: Shiba Inu Official Predicts BONE Price At $3 As Shytoshi Kusama Hints At Shibarium Launch
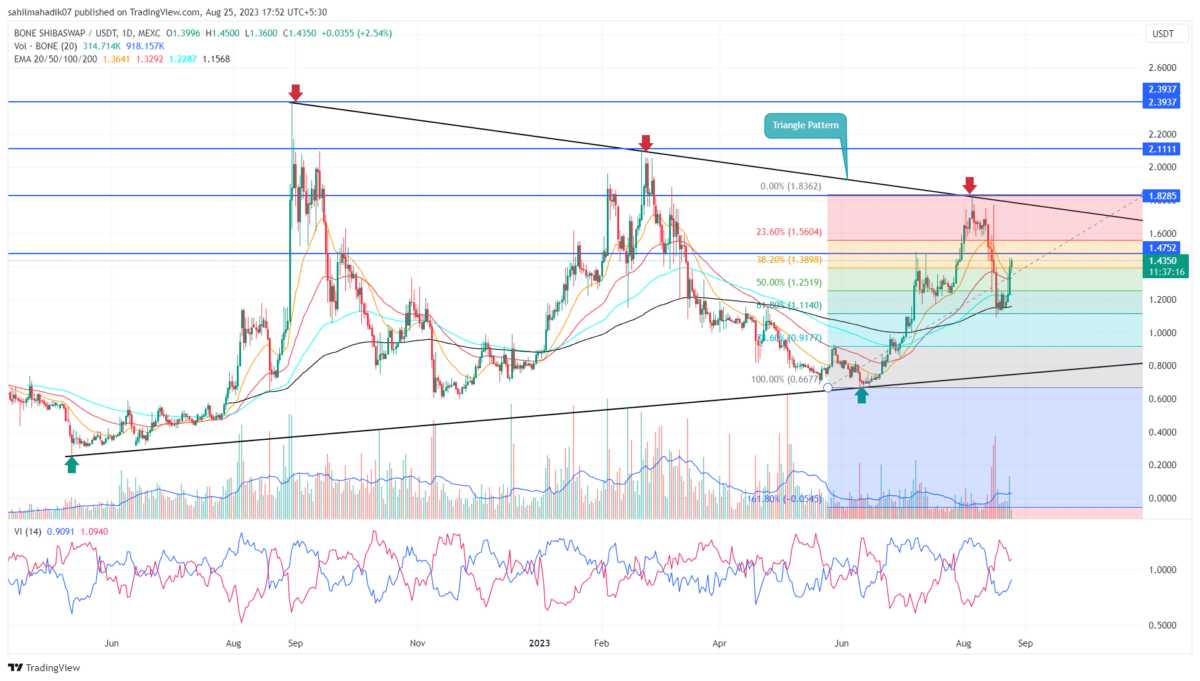
Bone ShibaSwap Price Daily Chart:
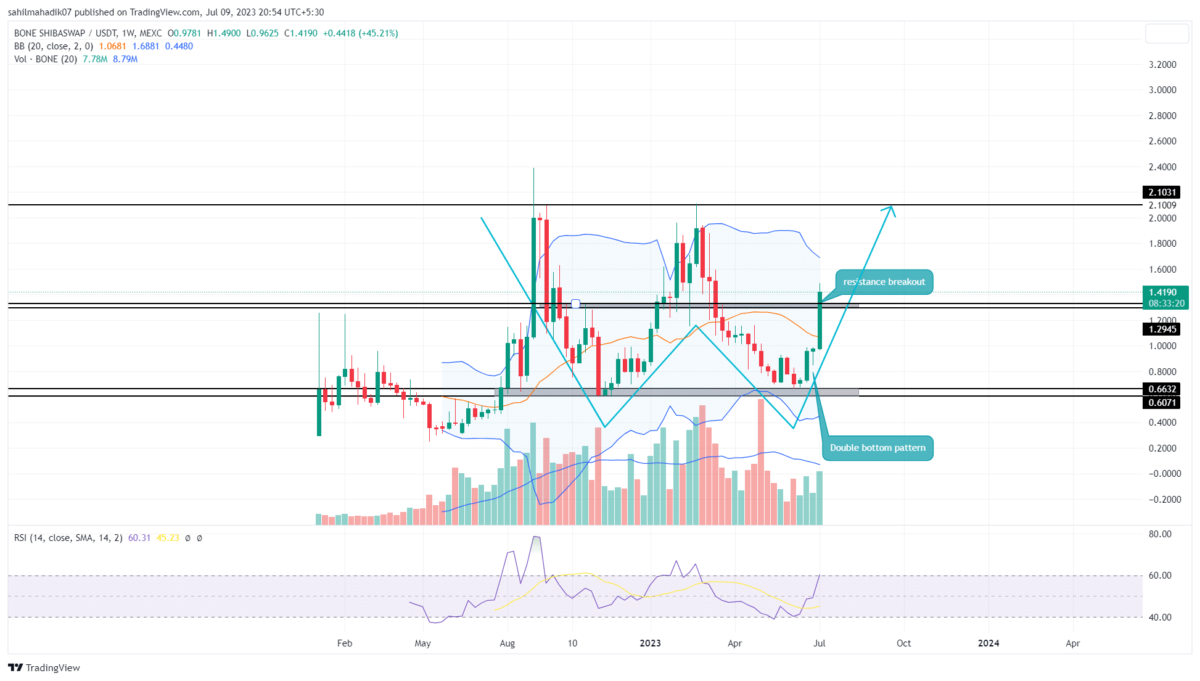
- The Bone token price shows the formation of a double bottom pattern in the weekly time frame chart.
- A breakout above $1.33 sets the coin price for a 50% rally.
- The intraday trading volume of the Bone ShibaSwap token is $15.8 Million, showing a 25% loss.
 Source- Tradingview
With a significant inflow in buying pressure, the Bone ShibaSwap token price showed a parabolic rally from the demand zone of $0.66-$0.6. The bullish rally backed by increasing volume indicates the growth of a sustained rally.
In addition, the rising price has recently breached a significant resistance zone of $1.3-$1.33. This breakdown provides buyers with a solid foothold to prolong the recovery rally. By the press time, the BONE price traded at $1.4, and with an intraday gain of 7.8%, it provides a suitable follow-up for long-portion trade.
However, the coin holders have already witnessed a massive rally in a short period, and therefore, if no more supporting news is provided, the BONE price likely experiences a pullback or consolidation above $1.3 before making the next leap.
Will Bone ShibaSwap Price Reach $2?
While the BONE price is likely to take a temporary halt to replenish bullish momentum, a look at the higher price chart reveals the formation of a double-bottom pattern. This bullish reversal pattern has set an upward trajectory for this token in the long term. If the coin price shows sustainability above $1.3, the buyers could drive a rally to $2 with an aim to surpass it.
- Relative Strength Index: The weekly-RSI slope at 60% reflects the bullish momentum in the market is aggressive.
- Bollinger Band: The downtick in the upper band of the Bollinger Band indicator could provide an additional barrier against buyers and cause a temporary pause in the uptrend.
Play 10,000+ Casino Games at BC Game with Ease
- Instant Deposits And Withdrawals
- Crypto Casino And Sports Betting
- Exclusive Bonuses And Rewards


Why Trust CoinGape
CoinGape has covered the cryptocurrency industry since 2017, aiming to provide informative insights Read more…to our readers. Our journal analysts bring years of experience in market analysis and blockchain technology to ensure factual accuracy and balanced reporting. By following our Editorial Policy, our writers verify every source, fact-check each story, rely on reputable sources, and attribute quotes and media correctly. We also follow a rigorous Review Methodology when evaluating exchanges and tools. From emerging blockchain projects and coin launches to industry events and technical developments, we cover all facets of the digital asset space with unwavering commitment to timely, relevant information.

Related Articles


- Peter Schiff Predicts BTC to Fall, Gold to Rise as Markets Price in Prolonged Iran War
- Institutional Re-Accumulation Signs Emerge as Bitcoin ETFs See $1.1B Net Inflows Since Iran War Began: Glassnode
- From Mining Pool to Infrastructure Platform: Nine Years of EMCD
- U.S.-Iran War: U.S. Oil Prices Spike To One-Year High, Bitcoin and Gold Dip
- Crypto Traders Bet Against U.S.-Iran Ceasefire This Month as Iran Denies Peace Talks
- HOOD Stock Targets $100 as Robinhood Unveils Platinum Card and Advance Dividend Feature
- Bitcoin Price Prediction if Donald Trump Signs the CLARITY Act on April 3, 2026
- Pi Network Price As BTC Rallies Above $74K: Can PI Coin Extend Gains to $0.30?
- XRP Price As Bitcoin Reclaims $74K- Is $5 Next?
- Dogecoin Price Outlook as BTC Recovers Above $73,000
- XRP Price Prediction as Iran-U.S. Peace Talks Trigger a Crypto Rally


