 Claim Card
BTC Price Crashes to $88K: 3 Charts That Show Bitcoin Bull is NOT Over


Highlights
- Bitcoin price crashed 11.36% to $88K after a failed attempt to revisit $100K.
- Over $900 million in positions were wiped out due to the sudden crypto market crash.
- Three Bitcoin charts suggest that the bull run is far from over, despite the recent price crash.
After a failed attempt to revisit $100K on February 21, Bitcoin (BTC) reversed. As a result, BTC price crashed 11.36% to $88K. The downtrend was exacerbated due to ByBit’s hack, but excessive leverage and cascading liquidations may have pushed Bitcoin even lower. As a result of this sudden crypto market crash, more than $900 million in positions have been wiped as Bitcoin price dropped to $90K. Despite this grim outlook, let’s discuss three Bitcoin charts that suggest the bull run is far from over.
3 Charts Point to BTC Bull Run After Bitcoin Price Crash
The first chart that hints at the continuation of the BTC bull run is the Fear and Greed Index, which has flashed extreme fear after the recent Bitcoin price crash to $90K. Although the liquidations were high, there might be another leg down in the near future. However, considering the bullish developments in the crypto ecosystem, like altcoin ETF approvals or from a regulatory standpoint, the bull run is far from over.
Moreover, during the bull run peak, the crypto markets are likely to be characterized by extreme greed rather than extreme fear.

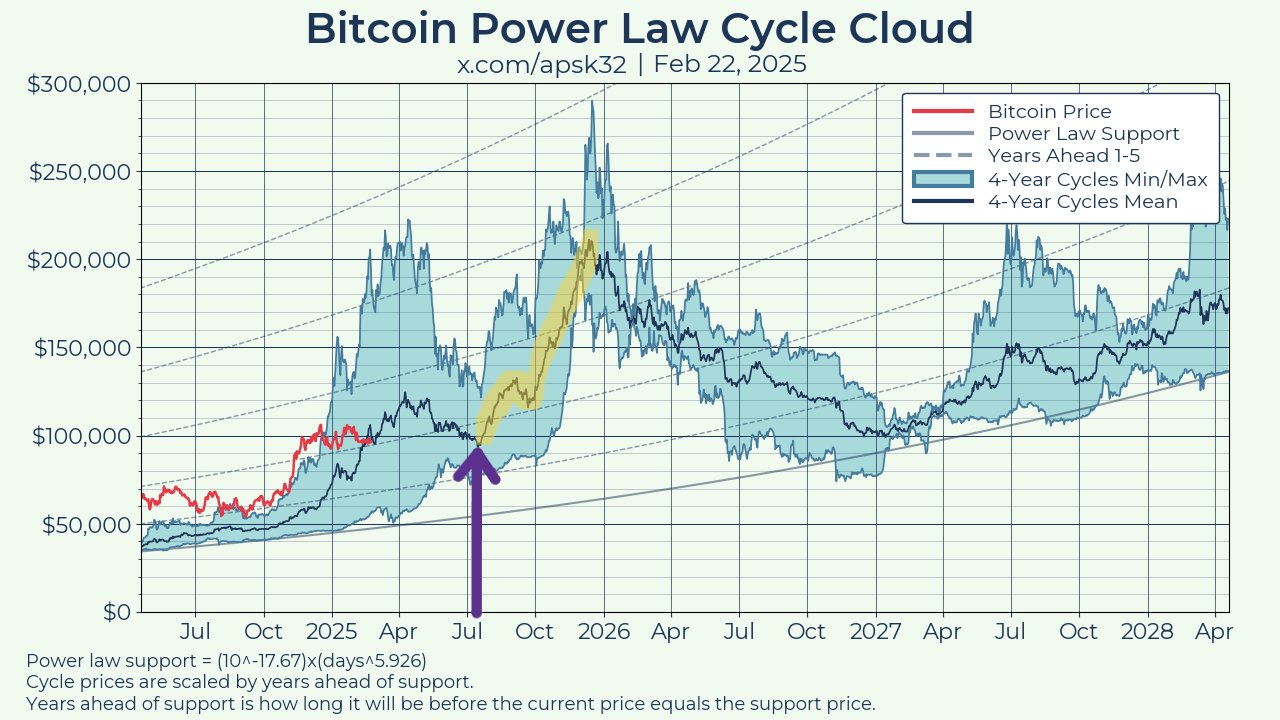
The second chart is the Bitcoin Power Law Cloud, which shows how the previous BTC price cycles, its standard deviation, and power law curves serve as a boundary that guides the next cycle. The Power Law chart shows that the recent Bitcoin price crash is well within the range of the model. The author is confident in this model as he states,
“Bitcoin could chop around $95k for four or five months and I’d still expect $200k+ in November. The pattern is very much intact. Get comfortable. Touch grass.”
The third macroeconomic chart in Shock’s post on X, dated February 24, 2025, displays Bitcoin price movements alongside the ISM (Institute for Supply Management) manufacturing index. The ISM is a key indicator of U.S. economic health, and imposing it on the BTC price chart shows an inverse connection.

Shock argues that selling crypto now would mean missing out on its “beauty” and potential parabolic growth.
Why Did Bitcoin Price Crash to $88?
While ByBit’s $1.5B hack may have initiated the reversal that prevented Bitcoin price from hitting $100K, excessive leverage and greed pushed BTC to $88K.
According to CryptoQuant data, the estimated leverage ratio rose from 0.235 to 0.271, a 17% uptick from February 3 to 20. During this period of Bitcoin price stagnation, the uptick in leverage denotes participants’ anticipation of a breakout. This growth shows more investors are willing to crank up the leverage with the expectations of a big win in the event of a breakout.
Although this metric crashed to 0.247 after the initial drop on February 20, it has increased to 0.270 despite Monday’s brutal crash. This suggests that the Bitcoin price is likely to crash again. A sudden crash in a high-leverage ecosystem typically leads to cascading sell orders that exacerbate the pain.

From a technical standpoint, the next key level to watch includes $93K. A rejection here could lead to a deeper correction to $88K. Such a BTC price crash could reduce the overall leverage ratio and hint at a bullish reversal.

On the other hand, a flip of the $93K hurdle into a support level enhances the bullish Bitcoin price prediction, propelling BTC to the next key resistance level of $95K.
Play 10,000+ Casino Games at BC Game with Ease
- Instant Deposits And Withdrawals
- Crypto Casino And Sports Betting
- Exclusive Bonuses And Rewards

Frequently Asked Questions (FAQs)
1. What triggered the Bitcoin price crash to $88K?
2. What does the Fear and Greed Index indicate about the current market sentiment?
3. What is the significance of the Bitcoin Power Law Cloud chart?

Why Trust CoinGape
CoinGape has covered the cryptocurrency industry since 2017, aiming to provide informative insights Read more…to our readers. Our journal analysts bring years of experience in market analysis and blockchain technology to ensure factual accuracy and balanced reporting. By following our Editorial Policy, our writers verify every source, fact-check each story, rely on reputable sources, and attribute quotes and media correctly. We also follow a rigorous Review Methodology when evaluating exchanges and tools. From emerging blockchain projects and coin launches to industry events and technical developments, we cover all facets of the digital asset space with unwavering commitment to timely, relevant information.

Related Articles


- Crypto Market Soars on Rumors of Trump’s 0% Tax Policy for Digital Assets
- Hong Kong Set to Launch Tokenized Bond Platform and Issue First Stablecoin Licenses
- US Senator Launches Probe Into Binance After Fortune Report on Sanctions Violations
- CLARITY Act Odds, Bitcoin Drop as Trump Skips Crypto in State of the Union Speech
- Tokenized Stock Market Gains Boost as Kraken and Binance Launches New Products
- Cardano Price Signals Rebound as Whales Accumulate 819M ADA
- Sui Price Eyes Recovery as Third Spot SUI ETF Debuts on Nasdaq
- Pi Network Price Eyes a 30% Jump as Migrations Jumps to 16M
- Will Ethereum Price Dip to $1,500 as Vitalik Buterin Continues Selling ETH?
- XRP Price Outlook as Clarity Act Passage Odds Plunge to 53%
- COIN Stock Risks Crashing to $100 as Odds of US Striking Iran Jump


