 Buy $GGs
BTC Price Knocks at the 90 Days Resistance level; Is Recovery Over?


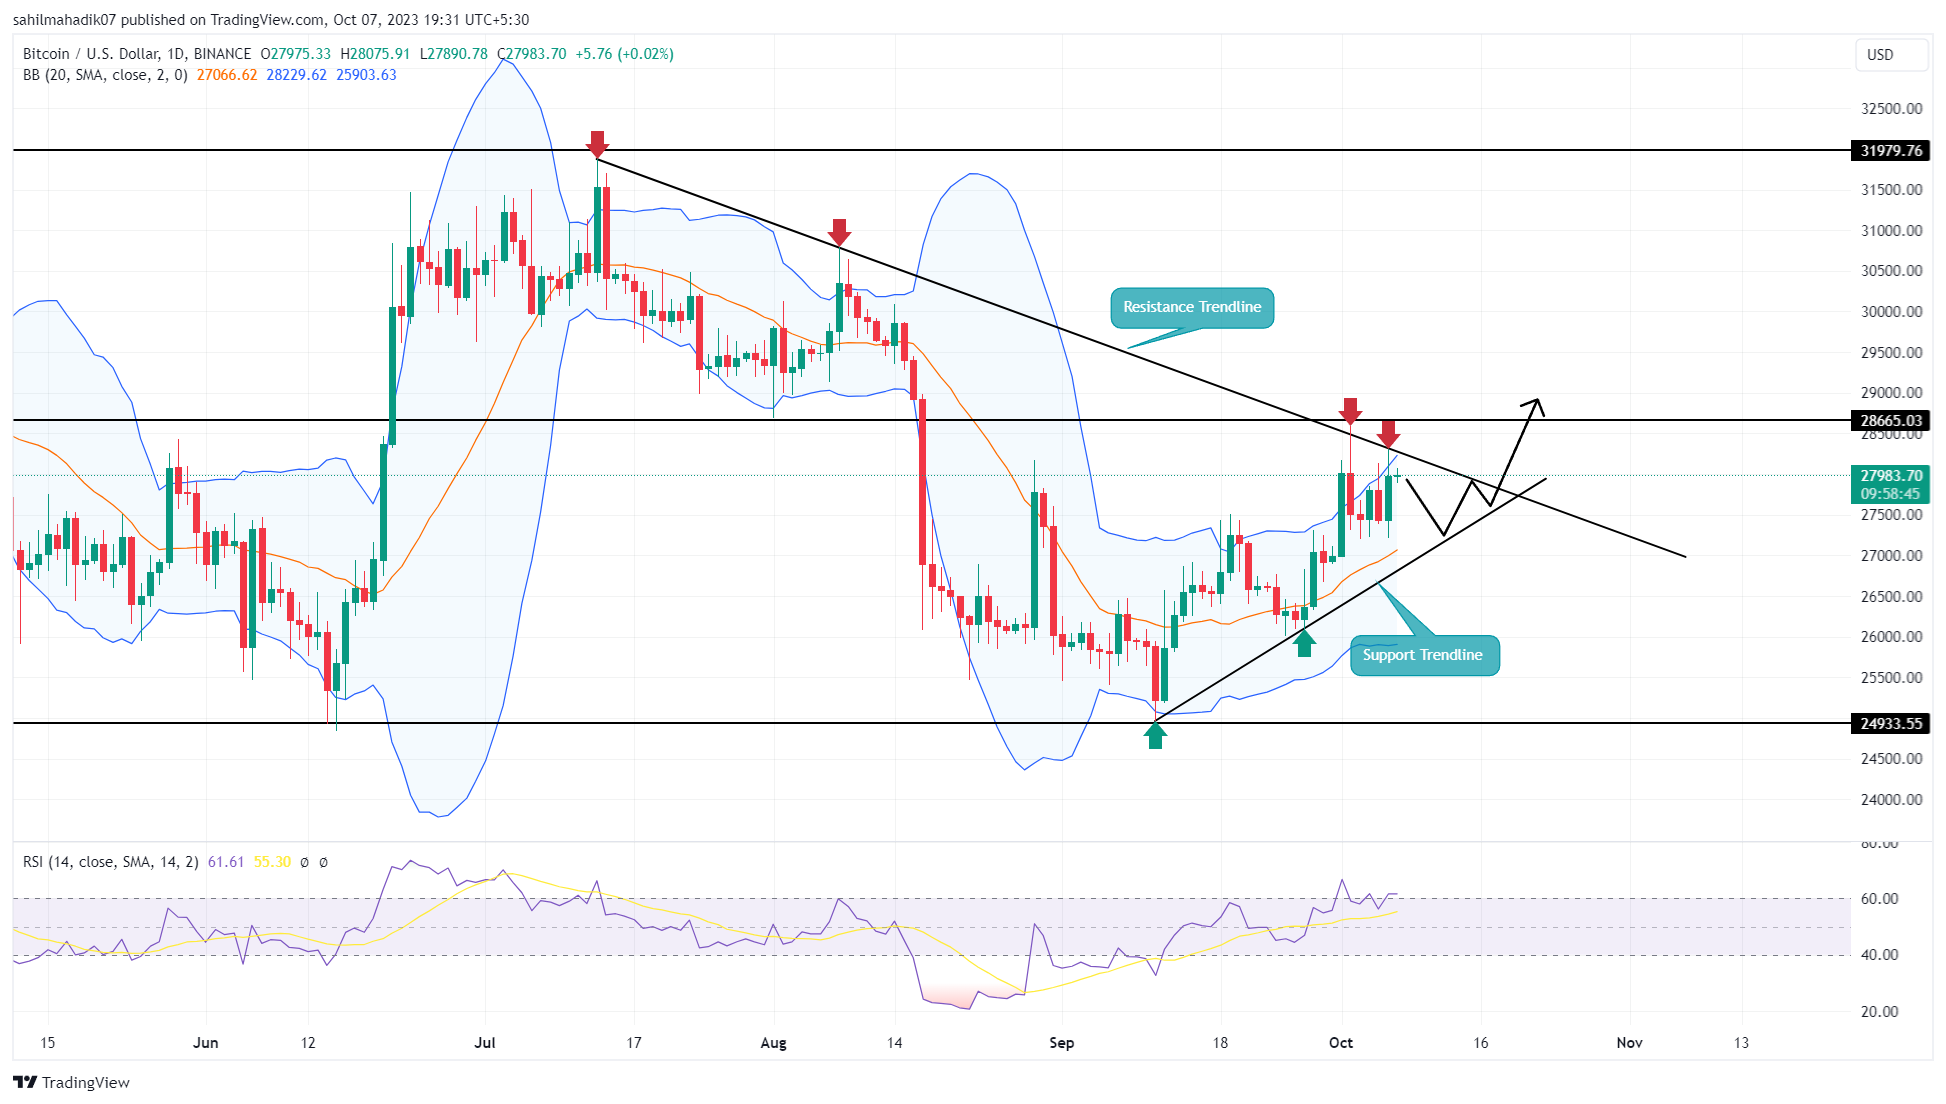
The ongoing recovery in Bitcoin price has encountered resistance near the $28,300 mark, coinciding with a long-standing descending trendline. Despite two recent attempts by bulls to clear this level, each effort was met with significant resistance, evidenced by the pronounced price rejection candles. Such patterns suggest sellers remain dominant at this juncture. Does this mounting pressure indicate a potential correction looming for BTC?
Also Read: Bengaluru Bitcoin Scam, Investigation Gains Pace With New Twists
Overhead Supply Threatens a Downfall to $25000
- A bullish breakout from the upper trendline could signal the end of the correction trend
- Bitcoin fear and greed index valuing at 49% reflects a neutral stance among market participants
- The intraday trading volume in Bitcoin is $10.7 Billion, indicating an 18% gain.
 Source-Tradingview
Since mid-September, The BTC price trajectory has been notably bullish, rallying from a supportive base at $25,000. Over the past month, its value has appreciated by roughly 12.5%, bringing its current trading price to approximately $28,017.
However, this bullish stride has been stymied near the $28,300 threshold, a region exacerbated by the selling pressure from the aforementioned descending trendline. This trendline has been a formidable barrier for approximately 90 days, repelling upward moves on four distinct occasions.
Should sellers maintain their grip, a near-term retracement seems plausible for the BTC price. A decisive breach beneath a new emerging support trendline, currently situated around $27,200, could precipitate a descent toward the $25,000 psychological support.
[converter id=”btc-bitcoin” url=”https://coingape.com/price/converter/btc-to-usd/”]
Will BTC Price Reclaim $30000 Mark?
Despite a significant pullback initiated around October 2nd, the BTC price has staunchly defended the $27,230 level, signaling that bulls are not capitulating and remain intent on breaching the established resistance. A daily candle close above this trendline would provide bulls with a vote of confidence, potentially marking the commencement of a renewed uptrend. In such a bullish scenario, the post-breakout dynamics could propel the coin price beyond the $30,000 mark, targeting resistance zones near $30,800 and subsequently around $32,000.
- Bollinger Band: The uptick in the upper band of the Bollinger band indicator accentuates the bullish momentum in still aggressiveness.
- Relative Strength Index: The steady rise in the daily RSI slope reflects the buyer’s attempt to prolong the recovery trend.
Play 10,000+ Casino Games at BC Game with Ease
- Instant Deposits And Withdrawals
- Crypto Casino And Sports Betting
- Exclusive Bonuses And Rewards


Why Trust CoinGape
CoinGape has covered the cryptocurrency industry since 2017, aiming to provide informative insights Read more…to our readers. Our journal analysts bring years of experience in market analysis and blockchain technology to ensure factual accuracy and balanced reporting. By following our Editorial Policy, our writers verify every source, fact-check each story, rely on reputable sources, and attribute quotes and media correctly. We also follow a rigorous Review Methodology when evaluating exchanges and tools. From emerging blockchain projects and coin launches to industry events and technical developments, we cover all facets of the digital asset space with unwavering commitment to timely, relevant information.

Related Articles


- Breaking: Ethereum Treasury BitMine Adds 50,928 ETH as Tom Lee Predicts March Bottom For Crypto Prices
- Bitget Champions Women’s Role in Crypto as Part of International Women’s Day Campaign
- Breaking: Michael Saylor’s Strategy Adds 3,015 BTC as Bitcoin Holds Steady Despite U.S.-Iran War
- BitMine’s Tom Lee Bets on ‘March Turnaround’ to Spark Crypto Market Recovery
- Bitget Unveils MotoGP-Inspired ‘Smarter Speed Challenge’ for Crypto, Stocks, and Gold Trading in Latest UEX Push
- Pi Coin Price Prediction for March 2026 Amid Network Upgrade, KYC Boost, Rewards Distribution
- Gold Price Nears ATH; Silver Eyes $100 Breakout on Us- Iran War
- Bitcoin And XRP Price As US Kills Iran Supreme Leader- Is A Crypto Crash Ahead?
- Gold Price Prediction 2026: Analysts Expect Gold to Reach $6,300 This Year
- Circle (CRCL) Stock Price Prediction as Today is the CLARITY Act Deadline
- Analysts Predict Where XRP Price Could Close This Week – March 2026


