 Buy $GGs
BTC Price Prediction: Where Will Bitcoin Price Head This Month; $25k or $18K?


BTC Price Prediction: The Bitcoin price showed an unclear trend for the first week of March, creating a sense of uncertainty in the market. However, the second week started on a bearish note as the coin price witnessed 4% in the last three days. As of now, this downfall halts at a strong support 0.382 Fibonacci retracement level, holding the hope of coin holders. Can BTC price resume a bullish recovery from here?
Key Points:
- The Bitcoin price spread narrowing within the falling wedge pattern indicates a breakout opportunity nearby.
- The ongoing correction phase in BTC price will continue until the wedge pattern is intact.
- The intraday trading volume in Bitcoin is $21 Billion, indicating a 7.2% loss.
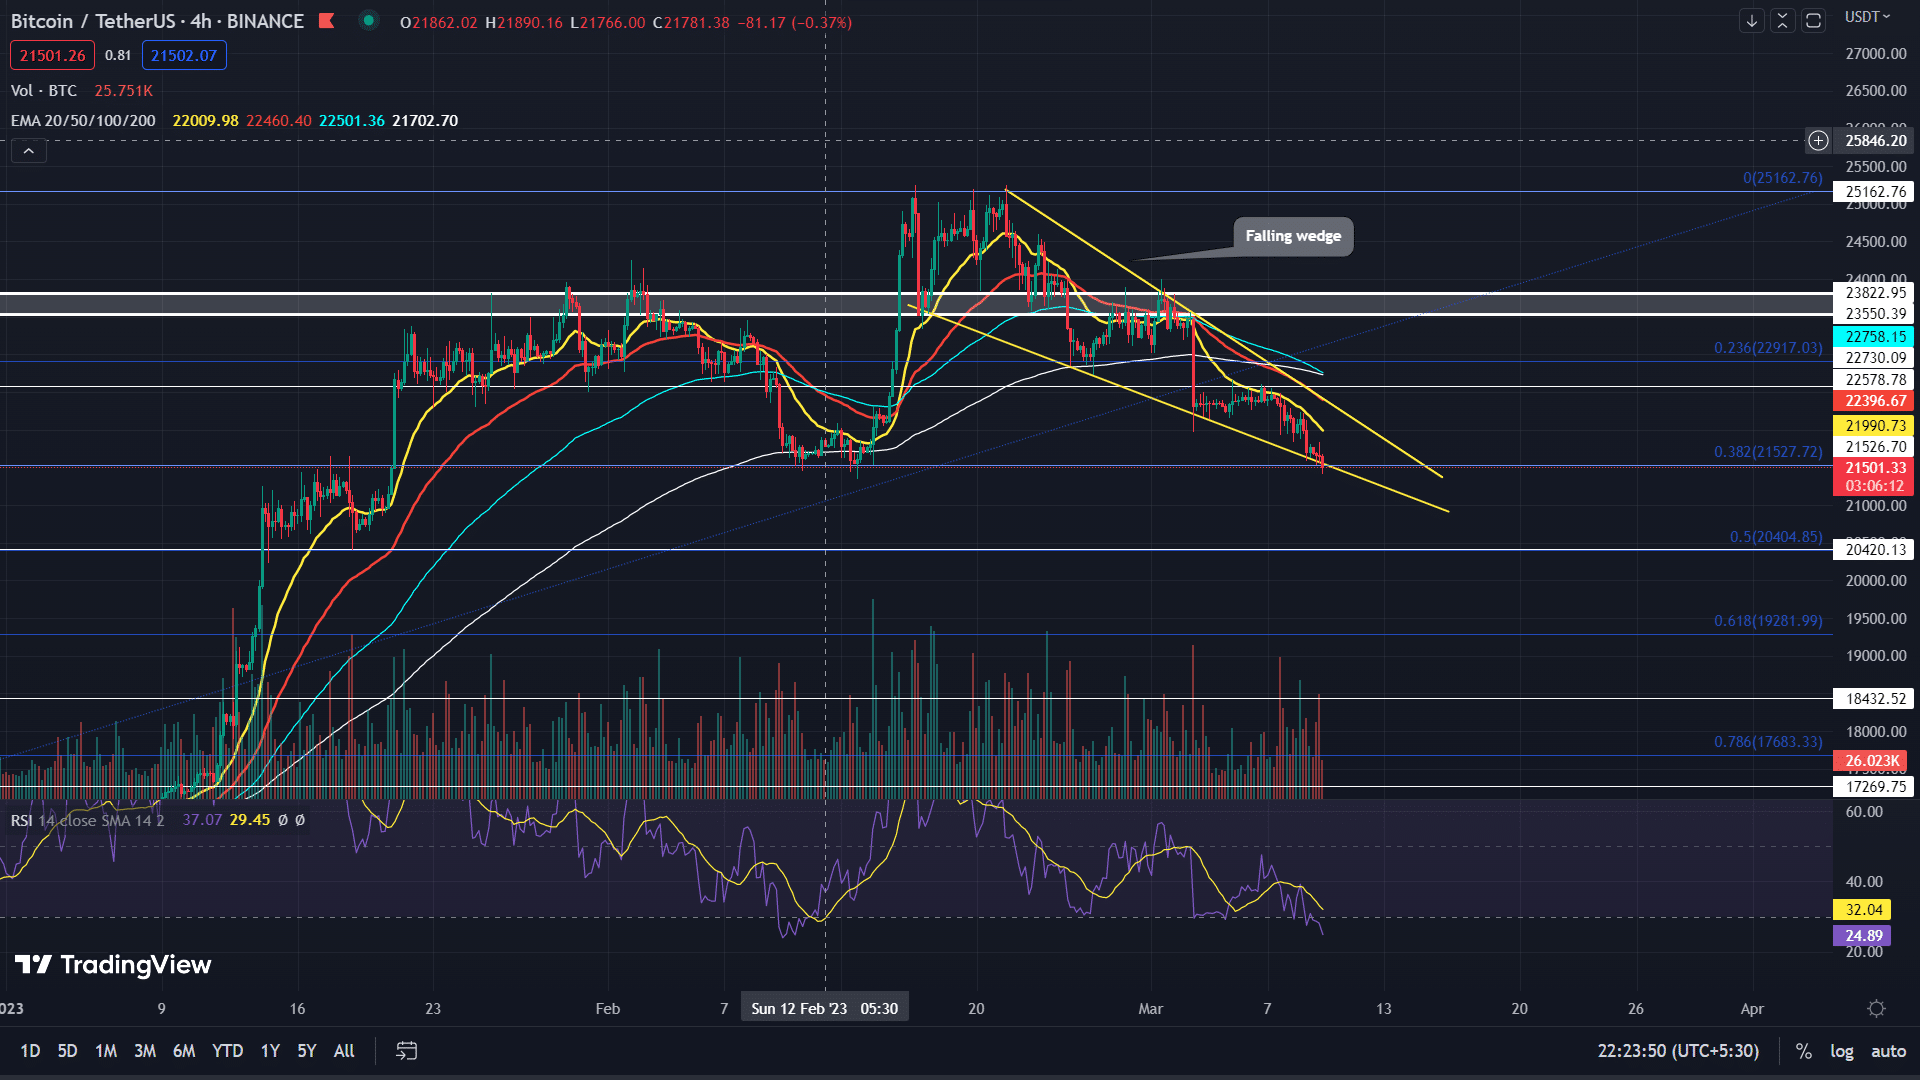 Source-Tradingview
The Bitcoin price has been in a correction phase for nearly three weeks now and has experienced a decline of 13.8% from the peak of $25200. This downfall has plunged the coin price to a combined support zone of 0.382 FIB and $21500 psychological level and the lower support trendline of a falling wedge pattern.
By the press time, the BTC price trades at $21636 and continues to hover above $21500 support. Usually, a retest to trendline support of the wedge pattern triggers a minor bullish pullback to hit the overhead trendline.
Also Read: Top 10 Carbon Negative Cryptos For 2023
However, the interested buyer will need a breakout above the resistance trendline to obtain a long entry opportunity in Bitcoin. This breakout will signal the end of the ongoing correction phase and a higher possibility of uptrend continuation.
The post-breakout rally may soar the BTC price to the following targets of $22400, $23800, or $25000.
On a contrary note, a breakdown below the lower support trendline will invalidate the bullish thesis.
Technical indicator
RSI: despite the declining price action, the daily RSI slope moving sideways signals the weakening of bullish momentum. Thus bullish divergence may offer additional confirmation for a wedge pattern breakout.
EMAs(4-hour chart)-: the 20-day EMA slope act as a dynamic resistance to Bitcoin price
Bitcoin Price Intraday Levels
- Spot rate: 21646
- Trend: Bearish
- Volatility: High
- Resistance levels- $22500 and $23800
- Support levels- $21500 and $20500
Play 10,000+ Casino Games at BC Game with Ease
- Instant Deposits And Withdrawals
- Crypto Casino And Sports Betting
- Exclusive Bonuses And Rewards


Why Trust CoinGape
CoinGape has covered the cryptocurrency industry since 2017, aiming to provide informative insights Read more…to our readers. Our journal analysts bring years of experience in market analysis and blockchain technology to ensure factual accuracy and balanced reporting. By following our Editorial Policy, our writers verify every source, fact-check each story, rely on reputable sources, and attribute quotes and media correctly. We also follow a rigorous Review Methodology when evaluating exchanges and tools. From emerging blockchain projects and coin launches to industry events and technical developments, we cover all facets of the digital asset space with unwavering commitment to timely, relevant information.

Related Articles


- US-Iran War: Reports Confirm Bombings In UAE, Bahrain and Kuwait As Crypto Market Makes Recovery
- XRP Price Dips on US-Iran Conflict, But Capitulation Signals March Rebound
- Crypto Market at Risk as U.S.–Iran War Threatens Inflation With Oil Price Surge
- Polymarket U.S.–Iran Strike Bets Fuel Insider Trading Speculation as Crypto Traders Net $1.2M
- Cardano’s DeFi TVL Climbs as USDCx Stablecoin Launches on Network
- Top Analyst Predicts Pi Network Price Bottom, Flags Key Catalysts
- Will Ethereum Price Hold $1,900 Level After Five Weeks of $563M ETF Selling?
- Top 2 Price Predictions Ethereum and Solana Ahead of March 1 Clarity Act Stablecoin Deadline
- Pi Network Price Prediction Ahead of Protocol Upgrades Deadline on March 1
- XRP Price Outlook As Jane Street Lawsuit Sparks Shift in Morning Sell-Off Trend
- Dogecoin, Cardano, and Chainlink Price Prediction As Crypto Market Rebounds


