
Bull Trap Puts MATIC Price At 15% Downside Risk; Keep Holding?


On February 15th, the MATIC coin price gave a strong breakout from the $1.3 neckline resistance of a rounding bottom pattern. The completion of this three-month-long pattern was supposed to accelerate the buying pressure and lead a direction uptrend. However, amid the ongoing uncertainty in the crypto market, the MATIC reversed from the $1.526 peak and plunged below the $1.3 support, showcasing failed breakout attempts or a bull trap.
Key Points
- A V-top reversal in MATIC price indicates strong sellers’ confidence to tumble the prices lower
- The 50-day EMA moving near $1.178 and 100-day EMA at $1.06 increases the support strength of these levels
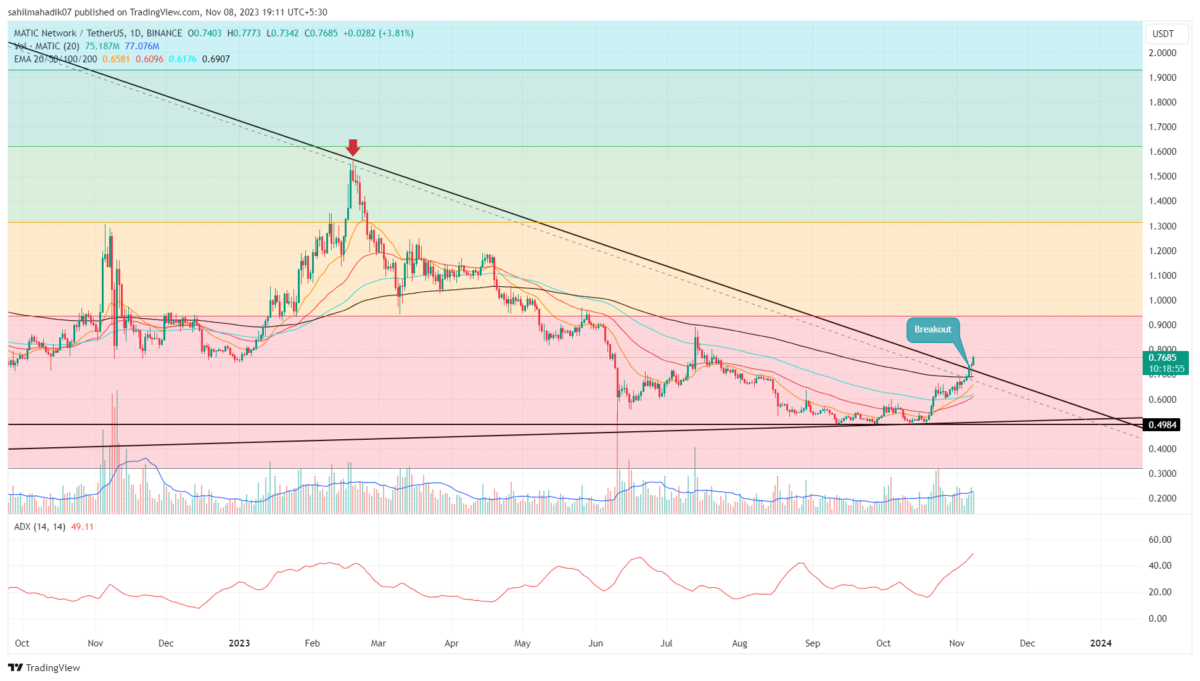
- The intraday trading volume in the MATIC is $735.2 Million, indicating a 37.5% gain.
 Source- -Tradingview
The last two weeks’ price action in MATIC price shows a V-top rejection from the $1.52 resistance levels. This type of rejection is characterized by an inverted V structure showcasing a rapid downfall in an asset’s price.
During this downfall, the polygon coin price lost 17.5% in market value and broke below the $1.3 support On February 24. A substantial loss on the aforementioned date could be associated with the release of the Personal Consumption Expenditures (PCE) price index showing higher than the expected value. As a result of this data, the US Fed is more likely to tighten its interest rate hike program, putting market sentiment under bearish turmoil.
Also Read: Bitcoin ($BTC) Quickly Losing Support Range; Price At $21K Next?
Thus, the $1.3 breakdown undermines the prior breakout and increases the possibility of further losses. If the altcoin sustains below the breached support, the sellers may drive the prices to $1.178( near the 0.5 Fibonacci retracement level), followed by $1.06(0.618 FIB level).
Any further breakdown will question the credibility of the overall bullish trend.
Technical Indicators
RSI: The daily RSI slope breakdown below the midline indicates the bullish sentiment fading away.
EMAs: The recent downfall breached the 20-day EMA slope which offered dynamic support during the last recovery cycle. This breakdown gives sellers an additional edge to put MATIC on a longer correction.
MATIC Coin Price Intraday Levels
- Spot rate: $1.26
- Trend: Bearish
- Volatility: Low
- Resistance levels- $1.3, and $1.52
- Support levels- $1.17 and $1.06
Play 10,000+ Casino Games at BC Game with Ease
- Instant Deposits And Withdrawals
- Crypto Casino And Sports Betting
- Exclusive Bonuses And Rewards


Why Trust CoinGape
CoinGape has covered the cryptocurrency industry since 2017, aiming to provide informative insights Read more…to our readers. Our journal analysts bring years of experience in market analysis and blockchain technology to ensure factual accuracy and balanced reporting. By following our Editorial Policy, our writers verify every source, fact-check each story, rely on reputable sources, and attribute quotes and media correctly. We also follow a rigorous Review Methodology when evaluating exchanges and tools. From emerging blockchain projects and coin launches to industry events and technical developments, we cover all facets of the digital asset space with unwavering commitment to timely, relevant information.


- Breaking: U.S. PCE Inflation Cools to 2.8%, Lower Than Expected
- Bitcoin Price Hits $72K, Top Reasons Why It’s Skyrocketing Today
- Playnance Plans March 18 Launch of G Coin as Activity Grows Across Its Blockchain Gaming Ecosystem
- PrimeXBT: How to trade gold with crypto, and why it remains the go-to macro asset
- What Happens to Oil Prices After April 11 Russian Sanctions Window?
- Why Pi Network Price Surged 30% Today?
- What Happens to XRP Price If US Wins War Against Iran?
- COIN Stock Prediction as Crypto Crash Odds Jump as Expert Sees Inflation Hitting 3.4%
- Cardano Price Turns Bullish as ADA Futures OI Hits $416M Ahead Of Key Upgrades
- Dogecoin Price Outlook If Elon Musk’s X Money Integrates Crypto- Is $0.2 Possible This Week?
- Will XRP Price Rally After Ripple’s Strategic Acquisition in Australia?


