 Buy $GGs
Emerging Bullish Pattern Hints XRP Price Recovery to Surpass $0.6


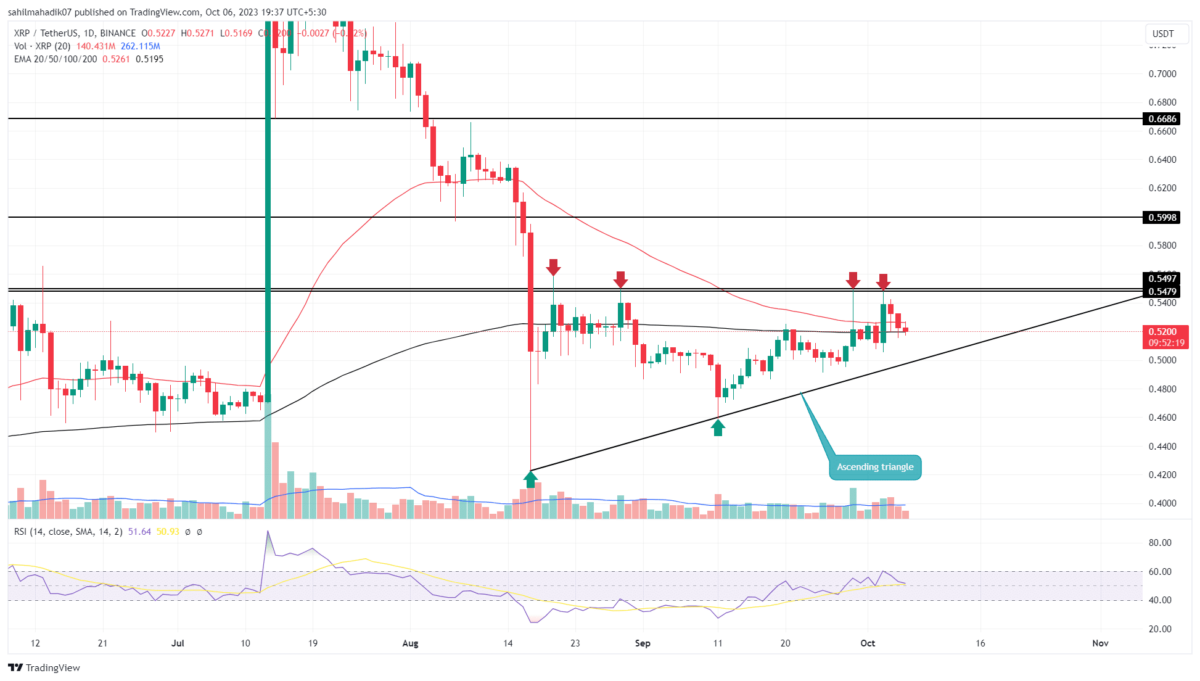
The XRP price has outlined an ascending triangle pattern on its daily chart, a formation frequently observed during established uptrends. This pattern typically represents a brief consolidation before the asset resumes its bullish momentum. Given this context, can buyers generate enough bullish momentum to propel it past the $0.55 mark?
Also Read: Whale Dumps $14 Mln XRP Despite Ripple’s Latest Wins
Triangle Pattern Hint Extended Recovery
- An ascending trendline prevents the XRP price from a major correction
- A bullish breakout from the $0.55 barrier could accelerate the market buying pressure
- The intraday trading volume in the XRP is $619 Million, indicating a 13% loss
 Source: Tradingview
In the span of the last seven weeks, the XRP price movement has largely been lateral. During this consolidation phase, this altcoin has fluctuated within defined boundaries set by a horizontal resistance at $0.548 and an ascending trendline acting as a dynamic support.
The price has touched the lower trendline on two occasions and has tested the upper boundary four times, underscoring the pattern’s strong influence on traders. On October 3rd, the coin price faced its fourth rejection from this upper resistance, leading to a 4% depreciation over the subsequent three days.
At this moment, XRP price is trading at $0.51. If the bearish pressure persists, we might see a further 2% dip, bringing the coin’s price to the ascending trendline’s support. However, this dynamic support could very well reignite bullish sentiment, potentially prompting a renewed challenge of the $0.55 resistance.
As long as the triangle’s boundaries remain unbreached, the XRP price movement may continue to oscillate within these confines.
[converter id=”xrp-xrp” url=”https://coingape.com/price/converter/xrp-to-usd/?amount=1″]
Will XRP Price Hit $0.6?
Historically, ascending triangle patterns often culminate in an upward breakout, heralding the continuation of the prevailing uptrend. Thus, if the XRP coin manages to close a daily candle beyond this resistance, we could anticipate a surge of roughly 9%, targeting the $0.6 mark, with a subsequent aim at the $0.68 level.
Play 10,000+ Casino Games at BC Game with Ease
- Instant Deposits And Withdrawals
- Crypto Casino And Sports Betting
- Exclusive Bonuses And Rewards


Why Trust CoinGape
CoinGape has covered the cryptocurrency industry since 2017, aiming to provide informative insights Read more…to our readers. Our journal analysts bring years of experience in market analysis and blockchain technology to ensure factual accuracy and balanced reporting. By following our Editorial Policy, our writers verify every source, fact-check each story, rely on reputable sources, and attribute quotes and media correctly. We also follow a rigorous Review Methodology when evaluating exchanges and tools. From emerging blockchain projects and coin launches to industry events and technical developments, we cover all facets of the digital asset space with unwavering commitment to timely, relevant information.

Related Articles


- Bitcoin Price Still Risks Decline If Iran War Mirrors Ukraine War Market Reaction, JPMorgan Warns
- Bitget Unveils Upgrade For Stock, Gold Trading Alongside Crypto As Part Of Universal Exchange Push
- ChangeNOW Is Settling Crypto Swaps in Under a Minute.
- $3B Western Union Expands Into Crypto With USDPT Stablecoin Launch on Solana
- XRP News: Key Ripple Whale Indicator Turns Bullish After Months, Price Rally Ahead?
- Bitcoin Price Prediction if Donald Trump Signs the CLARITY Act on April 3, 2026
- Pi Network Price As BTC Rallies Above $74K: Can PI Coin Extend Gains to $0.30?
- XRP Price As Bitcoin Reclaims $74K- Is $5 Next?
- Dogecoin Price Outlook as BTC Recovers Above $73,000
- XRP Price Prediction as Iran-U.S. Peace Talks Trigger a Crypto Rally
- COIN Stock Analysis as Bitcoin Retests $72k Ahead of February NFP Data


