Can Chainlink Price Breakout from $7.7 Lead to Bigger Gains?


In the daily time frame chart, the chainlink price shows a V-shaped recovery from the $5 psychological support. So far, the bull run has recorded 62% growth and reached the current trading price of $8.144. Will buyers maintain the bullish momentum or the LINK price is poised for a minor correction?
Also Read: Chainlink (LINK) Price Pumps 20%, Expect further Price Rally As Whales Accumulate
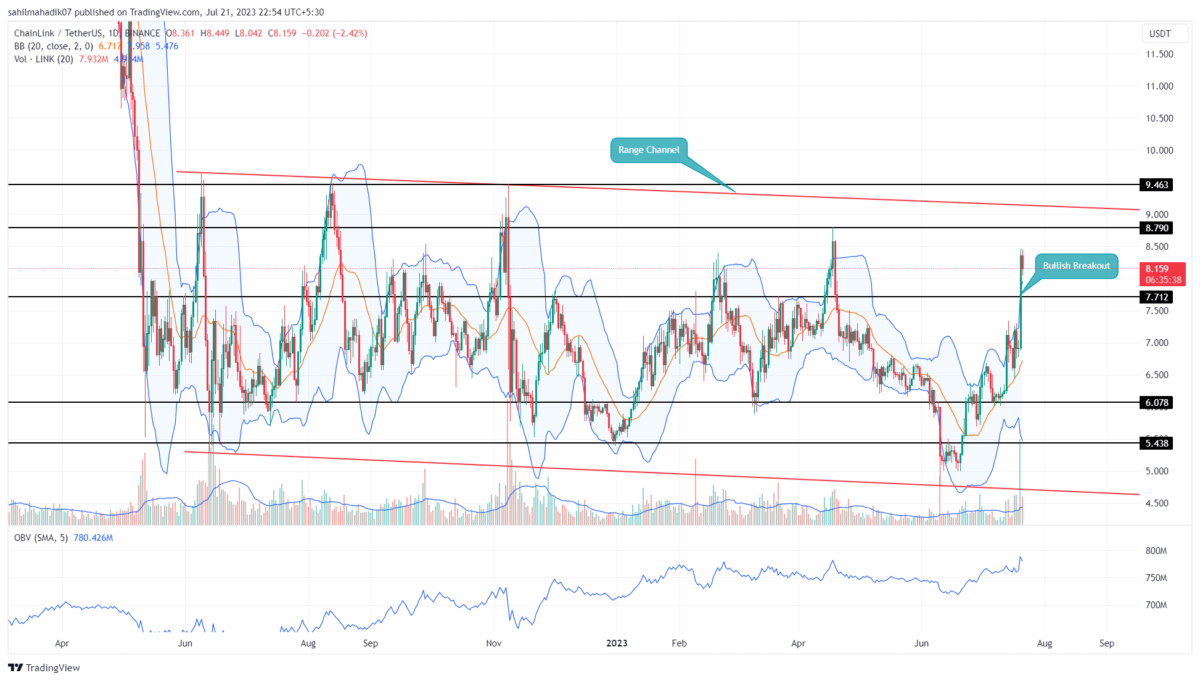
Chainlink Price Daily Chart
- A potential pullback to $7.7 could offer a pullback opportunity to traders.
- The coin holders may witness a high supply zone at $9
- The intraday trading volume in the LINK coin is $814 Million, indicating a 22% gain.
 Source- Tradingview
For over a year, the Chainlink price has remained in a range-bound trend restricted between two converging trendlines. Amid this sideways move, the coin price has rebounded from both trendlines at least twice indicating the traders are under the strong influence of this channel pattern.
Furthermore, the ongoing recovery rally has recently breached a significant resistance of $7.7. After an explosive rally or breakout, the asset price tends to correct or retest the prior resistance as potential support.
If the chainlink buyers sustained these higher prices, the recovery rally could prolong another 10-12% higher to reach the combined resistance of $9 and overhead trendline.
Can LINK Price Break $9?
The overhead trendline is carrying a long-term sideways and therefore holds significant importance in technical charts. With sustained buying, the LINK price would soon hit the trendline barrier and probably witness strong supply pressure. While the overall market remains uncertain, it is less likely the coin price could build bullish momentum to break the $9 barrier. Therefore, the coin holders could witness a reversal or consolidation below the aforementioned resistance.
- Bollinger Band: The LINK price challenges the upper band of the Bollinger band indicator suggesting the market buying pressure is aggressive.
- On Balance Volume: The rising OBV slope indicates the buyer’s strong interest in a long position and therefore a sustained recovery in this cryptocurrency.

Why Trust CoinGape
CoinGape has covered the cryptocurrency industry since 2017, aiming to provide informative insights Read more…to our readers. Our journal analysts bring years of experience in market analysis and blockchain technology to ensure factual accuracy and balanced reporting. By following our Editorial Policy, our writers verify every source, fact-check each story, rely on reputable sources, and attribute quotes and media correctly. We also follow a rigorous Review Methodology when evaluating exchanges and tools. From emerging blockchain projects and coin launches to industry events and technical developments, we cover all facets of the digital asset space with unwavering commitment to timely, relevant information.

Related Articles


- Expert Says Bitcoin Now in ‘Stage 4’ Bear Market Phase, Warns BTC May Hit 35K to 45K Zone
- Bitcoin Price Today As Bulls Defend $65K–$66K Zone Amid Geopolitics and Tariffs Tensions
- XRP Realized Losses Spike to Highest Level Since 2022, Will Price Rally Again?
- Crypto Market Rises as U.S. and Iran Reach Key Agreement On Nuclear Talks
- Trump Tariffs: U.S. Raises Global Tariff Rate To 15% Following Supreme Court Ruling
- Shiba Inu Price Feb 2026: Will SHIB Rise Soon?
- Pi Network Price Prediction: How High Can Pi Coin Go?
- Dogecoin Price Prediction Feb 2026: Will DOGE Break $0.20 This month?
- XRP Price Prediction As SBI Introduces Tokenized Bonds With Crypto Rewards
- Ethereum Price Rises After SCOTUS Ruling: Here’s Why a Drop to $1,500 is Possible
- Will Pi Network Price See a Surge After the Mainnet Launch Anniversary?


