 Buy $GGs
Can Litecoin Price See 6% Jump This Week?


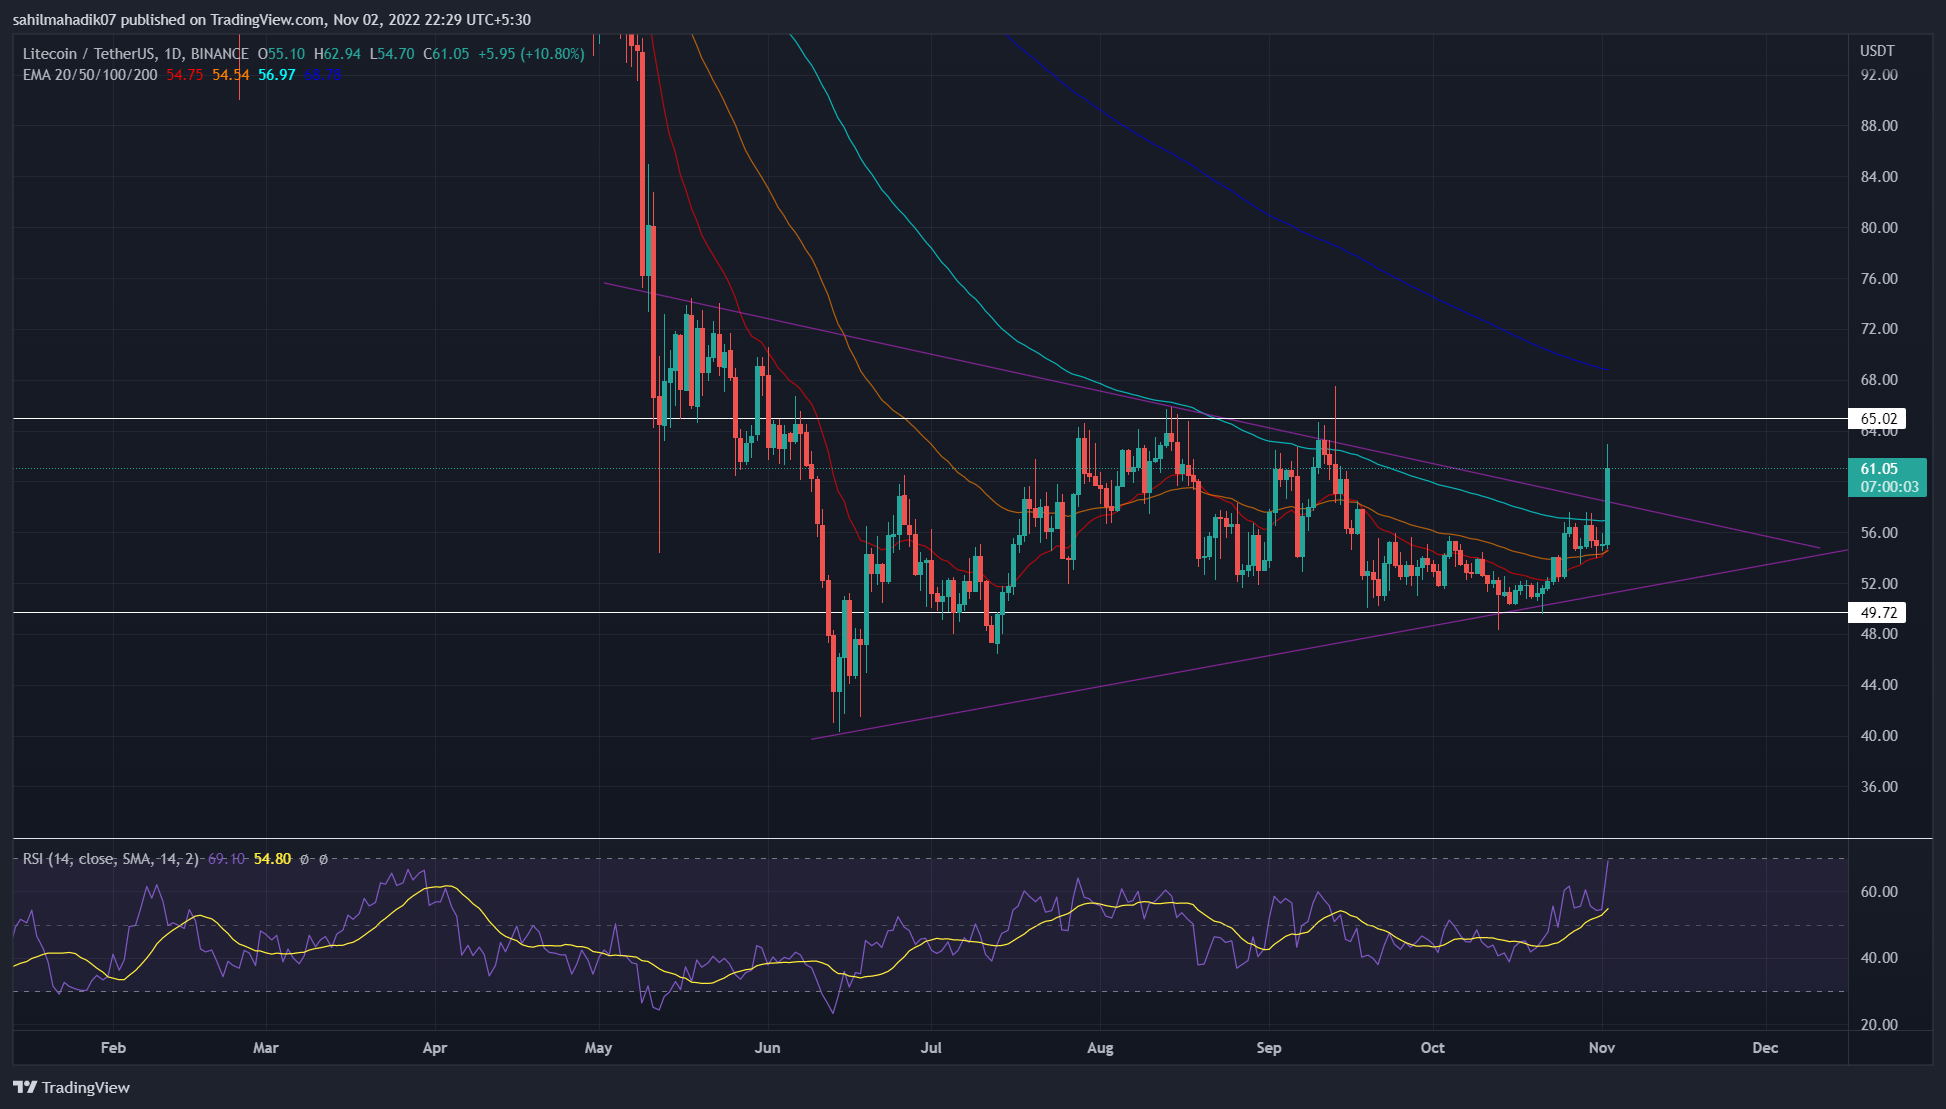
With a comparably bullish week in the crypto market, the altcoins are performing well to restart the uptrend. Coming out of the shadows, Litecoin price jumped 10.32% last week, resulting in a pattern breakout entry opportunity for short to midterm traders.
Key points:
- The massive bullish candle with sufficient could jump triggers the triangle pattern breakout in the daily chart.
- A bullish rally above the 50-and-100-day EMAs encourages a bullish crossover.
- The intraday trading volume in the LTC is $1.3 Million, indicating a 184% gain.
 Source- Tradingview
The Litecoin price has resonated in a symmetrical triangle pattern for the last five months. However, in response to the recent recovery phase in the crypto market, the buyers strengthened their grip on trend control, which resulted in a bullish breakout from this chart pattern.
With a 10.38% spike in the last 24 hours, the Litecoin price breached the pattern’s resistance trendline with a long bullish candle. Thus, completing this pattern on a bullish note accelerates the bullish momentum and provides an early sign of trend reversal.
Moreover, the price recovery showcased sustainability above the recently reclaimed 20-and-50-day EMA. Moreover, with today’s price jump, Litecoin gained a 100-day EMA sloped, offering an extra edge for holders.
 Source- Tradingview
Analyzing the weekly chart, the altcoin price action inchoates a double bottom pattern with a neckline at $64. Furthermore, the bullish breakout in the daily chart bolsters the trend reversal in the weekly timeframe. Under the influence of this pattern, the buyers should drive 6% high to aforementioned resistance.
On a contrary note, if the uptrend fails to cross the neckline at $64, a reversal will start a price correction.
Technical Indicator
Relative Strength Index: the daily-RSI slope spikes into the overbought zone, whereas the weekly RSI slope just starts an uptrend. Thus, the indicator shows a high likelihood of an uptrend with a minor correction to retest the triangle breakout.
VI Indicator: The Bullish gap increases between the VI lines to maintain the buy signal in short to mid-term. However, the VI lines maintain the sideways noise keeping a neutral signal.
Litecoin price intraday level
- Spot price: 61.1
- Trend: Bullish
- Volatility: Low
- Resistance levels: $2 and $2.45
- Support levels: $1.7 and $1.5
Play 10,000+ Casino Games at BC Game with Ease
- Instant Deposits And Withdrawals
- Crypto Casino And Sports Betting
- Exclusive Bonuses And Rewards


Why Trust CoinGape
CoinGape has covered the cryptocurrency industry since 2017, aiming to provide informative insights Read more…to our readers. Our journal analysts bring years of experience in market analysis and blockchain technology to ensure factual accuracy and balanced reporting. By following our Editorial Policy, our writers verify every source, fact-check each story, rely on reputable sources, and attribute quotes and media correctly. We also follow a rigorous Review Methodology when evaluating exchanges and tools. From emerging blockchain projects and coin launches to industry events and technical developments, we cover all facets of the digital asset space with unwavering commitment to timely, relevant information.

Related Articles


- Core Scientific Sells 1,900 BTC as Bitcoin Miner Pivots to AI, CORZ Stock Dips
- Bitcoin News: VanEck CEO Projects Gradual BTC Rally in 2026 as ETFs Sees $458M Inflows
- Bitcoin, Gold Slip as Donald Trump Says “Unlimited Munition Stockpiles” for US-Iran War
- Crypto Prices Today: BTC, ETH, XRP Prices Surge Despite Iran’s Strait of Hormuz Closure
- Nasdaq Brings Prediction Markets to Wall Street with New SEC Filing
- Bitcoin Price Prediction as US-Iran War Enters 4th Consecutive Day
- Top 5 Historical Reasons Dogecoin Price Is Not Rising
- Pi Coin Price Prediction for March 2026 Amid Network Upgrade, KYC Boost, Rewards Distribution
- Gold Price Nears ATH; Silver Eyes $100 Breakout on Us- Iran War
- Bitcoin And XRP Price As US Kills Iran Supreme Leader- Is A Crypto Crash Ahead?
- Gold Price Prediction 2026: Analysts Expect Gold to Reach $6,300 This Year


