 Buy $GGs
Can Shiba Inu Price Surge 20% as 527 Trillion SHIB Nears Profitability?


Highlights
- Shiba Inu price may form a 20% rally to $0.000016 if it overcomes neckline resistance in a double bottom pattern.
- After a 6% surge this week, Shiba Inu approaches a crucial zone between $0.000014 and $0.000019 where 527 trillion SHIB are underwater.
- Shiba Inu could face resistance at this supply zone if short term sellers chase profits.
Shiba Inu (SHIB) is up 6% this week after jumping from $0.0000125 to a seven-day high of $0.0000133 on June 11, as trading volumes hit $210 million. Technical analysis shows the emergence of a double-bottom pattern that could spark a 20% rally as 527 trillion SHIB tokens near profitability. As bullish signals align, can Shiba Inu price surge to $0.000016 in the near term?
Shiba Inu Price Gears for 20% Rally as it Tests Crucial Resistance
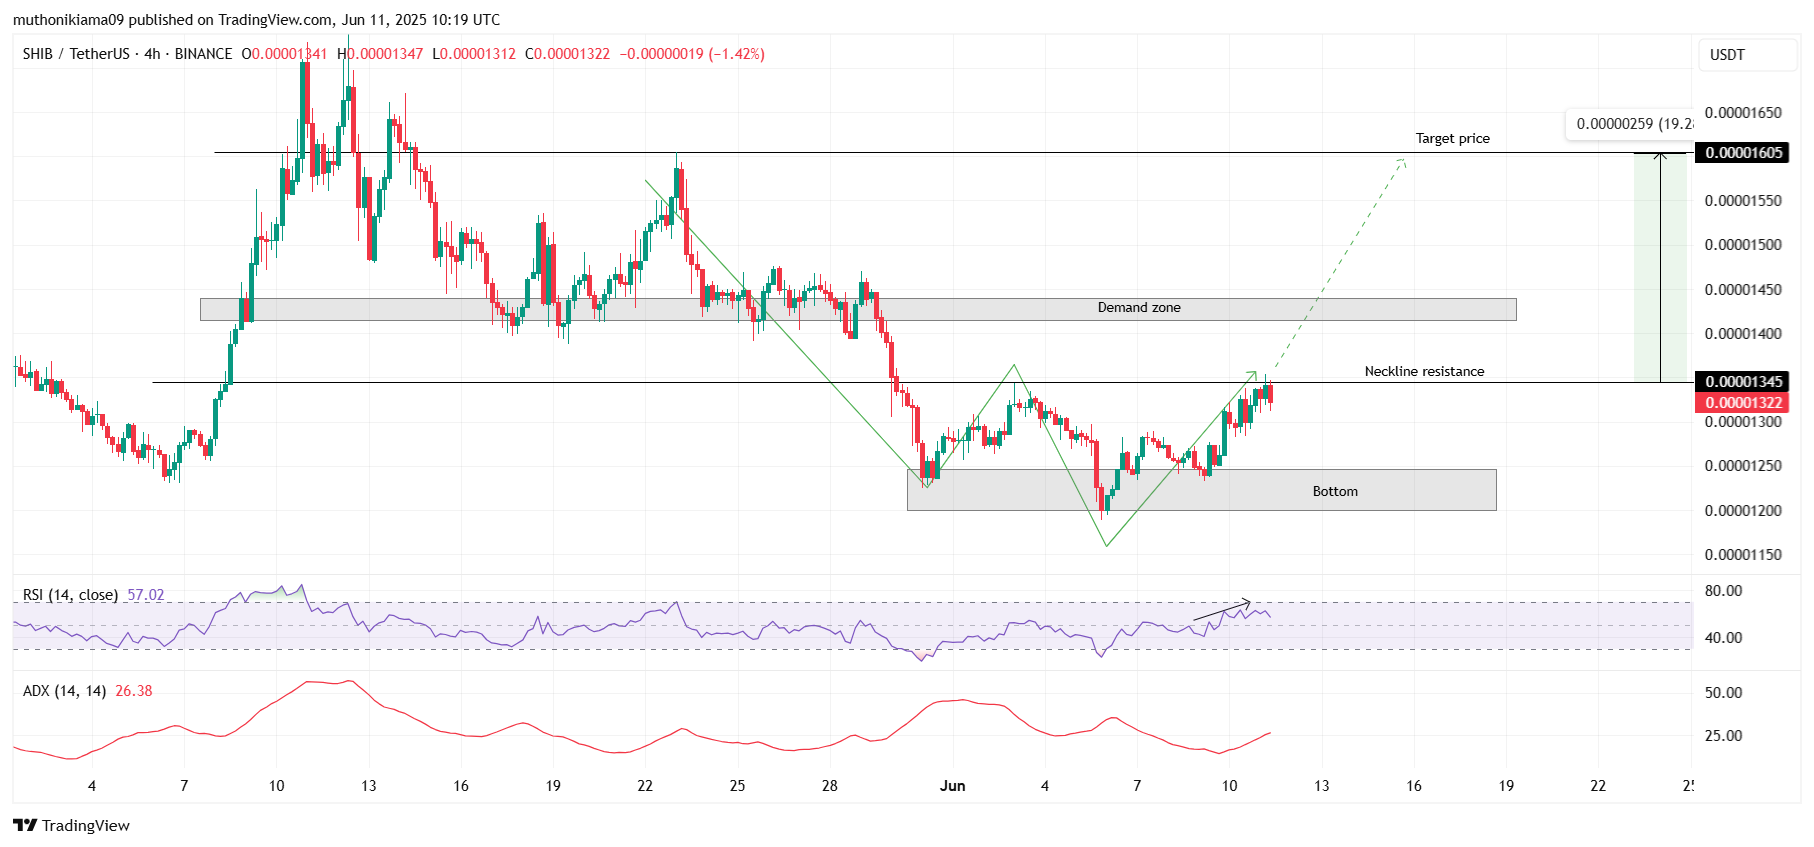
Shiba Inu price has formed a double-bottom pattern on the four-hour timeframe, with both bottoms visible around the $0.000012 and $0.0000124 price range. This zone has attracted buying interest over the past two weeks, which also makes it a strong support.
The neckline of this bullish pattern sits at the $0.0000134 price, which SHIB was attempting to breach at press time. If the price confirms a close above this resistance level, it will validate the bullish double bottom pattern that could propel the popular meme coin to the $0.000016 price, representing a nearly 20% gain from the neckline.
However, before the rally to $0.000016 commences, Shiba Inu price would first have to move past a key supply zone between $0.0000141 and $0.0000144. The dog-themed meme token flipped this zone into resistance after the May 29 crash that triggered a 15% decline to $0.000012. Once it crosses above this zone, the rally to $0.000016 will be imminent.
Adding to this bullish outlook is the RSI, which has made higher highs and higher lows to stand at 59. The RSI’s movement shows bullish momentum towards SHIB price is growing. Meanwhile, the ADX line is sloping upwards, also showing a positive outlook. This further suggests that the uptrend that started when Shiba Inu tested support at the second bottom is strengthening.
Additionally, CoinGape’s recent analysis noted that despite declining whale transactions, Shiba Inu price remains steady. This highlights strong interest from retail traders who are seeking profits during the ongoing rally.
527 Trillion SHIB Nears Profitability
Data from the on-chain analytics platform IntoTheBlock shows that 83% of all Shiba Inu holders are currently underwater (in losses), and only 14% are in profit. This skewed distribution of SHIB holder profitability depicts a key resistance zone between $0.000014 and $0.000019, where more than 572 trillion SHIB tokens were purchased.
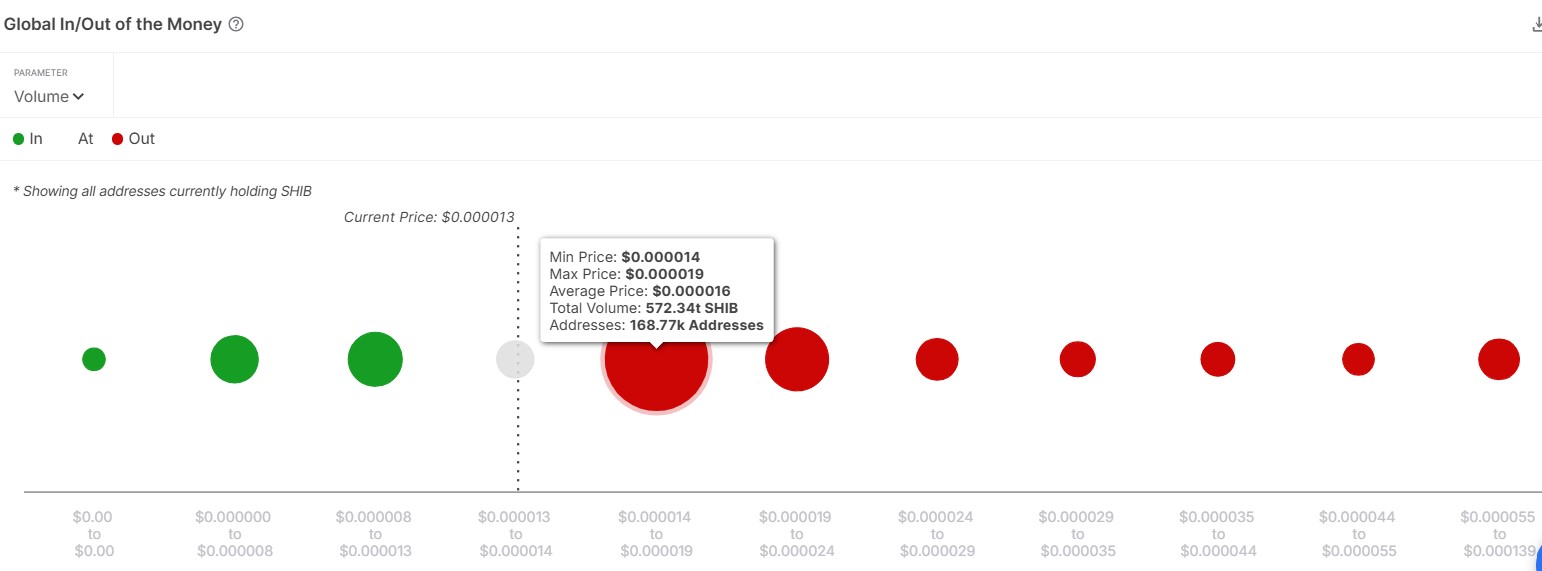
The 168,000 addresses that bought SHIB at this zone are likely to start selling once Shiba Inu price enters this price range. Until SHIB clears this level, the meme token could remain vulnerable to sell-side pressure from holders looking to break even.
However, if Shiba Inu can break out above $0.0000147 and extend the uptrend to $0.000016, short-term sellers may hesitate to sell, fuelling a bullish continuation.
In conclusion, Shiba Inu price is at a crucial point as it tests resistance at the neckline of a double bottom pattern. A breakout could kickstart an upward rally to $0.000016. However, with 527 trillion tokens in loss between $0.000014 and $0.000019, an uptrend may face resistance if short-term holders choose to sell.
For a more technical outlook on Shiba Inu’s price prediction from now until 2030 – Read This.
Play 10,000+ Casino Games at BC Game with Ease
- Instant Deposits And Withdrawals
- Crypto Casino And Sports Betting
- Exclusive Bonuses And Rewards

Frequently Asked Questions (FAQs)
1. Can Shiba Inu price rally 20% to $0.000016?
2. How will Shiba Inu price react as 527 trillion SHIB tokens near profitability?
3. What is the key support level for SHIB price?

Why Trust CoinGape
CoinGape has covered the cryptocurrency industry since 2017, aiming to provide informative insights Read more…to our readers. Our journal analysts bring years of experience in market analysis and blockchain technology to ensure factual accuracy and balanced reporting. By following our Editorial Policy, our writers verify every source, fact-check each story, rely on reputable sources, and attribute quotes and media correctly. We also follow a rigorous Review Methodology when evaluating exchanges and tools. From emerging blockchain projects and coin launches to industry events and technical developments, we cover all facets of the digital asset space with unwavering commitment to timely, relevant information.
24 Hours volume
$139.78M
Market Cap
$3.36B
Max Supply
1000T

Related Articles


- Peter Brandt Flips Bullish, Predicts Bitcoin Rally As Price Holds Above $70k
- XRP News: Institutional Use Case Expands as Doppler Finance Integrates WXRP for Multi-Chain Access
- Trump Tariffs: Bitcoin Faces Fresh Headwinds as 15% Global Tariffs Begin This Week Amid Iran War
- Bitget Unveils ‘Crypto Anti-Bias Pledge’ To Support Women’s Inclusion In Crypto
- U.S.-Iran War: Crypto Market Rebounds as Iran Reportedly Reaches Out To U.S. To End Conflict
- Dogecoin Price Outlook as BTC Recovers Above $73,000
- XRP Price Prediction as Iran-U.S. Peace Talks Trigger a Crypto Rally
- COIN Stock Analysis as Bitcoin Retests $72k Ahead of February NFP Data
- Robinhood Stock Price Prediction As Cathie Wood Buys $12M Dip in Bold ARK Move
- Bitcoin Price At Risk? Professor Who Predicted US-Iran War Says America Could Lose
- Gold Price Prediction March 2026: Rally, Crash, or Record Highs?


