Can This Bullish Pattern Assist Polygon Coin To Reach $1?


The Polygon coin chart shows the formation of the Flag pattern in the daily time frame chart. In theory, the ongoing correction is responsible for stabilizing the aggressive buying from the previous rally. Furthermore, a bullish breakout from the pattern’s resistance trendline triggers this continuation pattern and may resume the prevailing recovery.
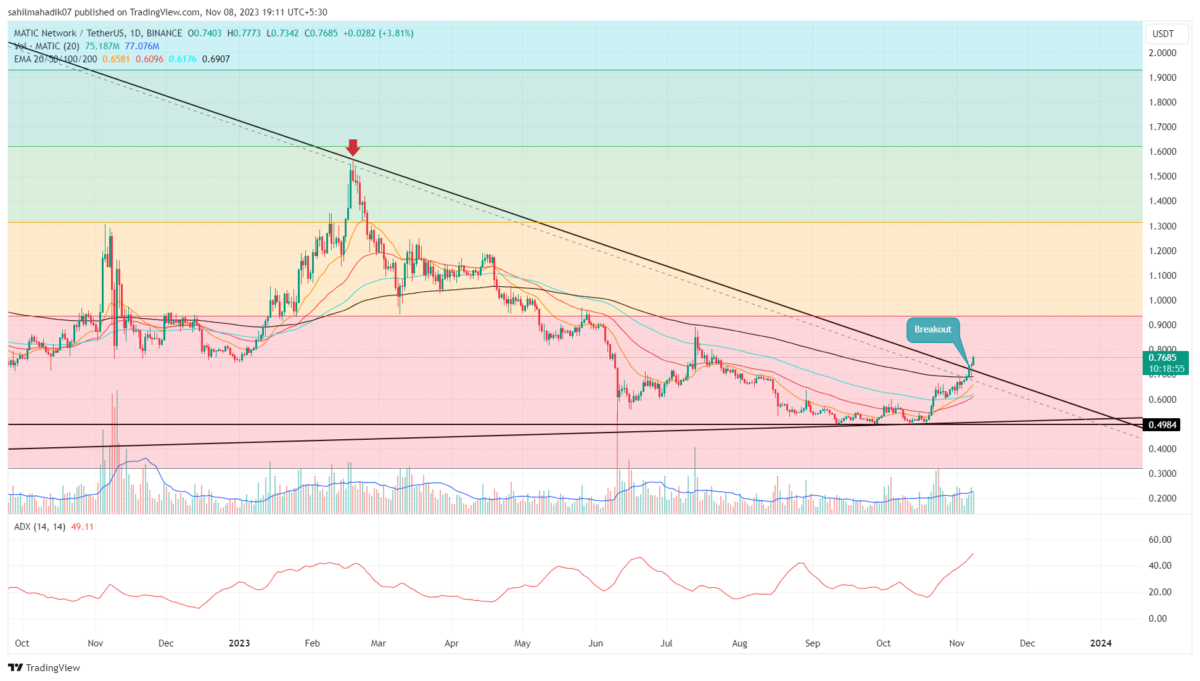
Key points
- The polygon coin price continues to face selling pressure at the resistance trendline.
- A breakout above the resistance trendline will invalidate the downside theory.
- The intraday trading volume in the MATIC is $748.3 Million, indicating a 24.5% gain.
 Source- –Tradingview
The declining trend continues in the Polygon market price within a flag, accounting for a drop of 31.5%. Additionally, the price drop breached the crucial support level of $0.75, leading to a dump of $0.69.
However, the price obtained significant support at the pattern’s support trendline and revert the coin 20%. Furthermore, the recovery rally challenges the wedge patterns resistance trendline increasing the possibility of a bullish breakout.
Also read: Take Crypto Gambling To A New Level With Polygon On 1xBit
Currently, the Polygon market price shows a growth of 4.22% resulting in multiple bullish engulfing candles. Furthermore, the spike in buying pressure during the recovery rally increases the possibility of a bullish breakout.
Thus, daily candle closing above the resistance trendline will indicate a shift in market sentiment from selling on rallies to buying on dips. Moreover, a post-breakout rally may offer a long-term buying opportunity with a target of the $1 level.
On a contrary note, if the selling pressure persists and reverts the price from this resistance, a prolonged correction might test the psychological mark of $0.50.
Technical Indicators
EMAs: the flattish EMAs (20, 50, and 100) accentuate a sideway rally in MATIC price.
MACD Indicator: the rising spread between the bullish alignment of MACD and the signal line shows sustained buying activity from traders. Moreover, these on the verge of crossing above the midline will offer additional confirmation for buyers.
Polygon Coin Price Intraday Levels
- Spot rate: $0.83
- Trend: Bullish
- Volatility: Low
- Resistance levels- $0.94 and $1.02
- Support levels- $0.755 and $0.7

Why Trust CoinGape
CoinGape has covered the cryptocurrency industry since 2017, aiming to provide informative insights Read more…to our readers. Our journal analysts bring years of experience in market analysis and blockchain technology to ensure factual accuracy and balanced reporting. By following our Editorial Policy, our writers verify every source, fact-check each story, rely on reputable sources, and attribute quotes and media correctly. We also follow a rigorous Review Methodology when evaluating exchanges and tools. From emerging blockchain projects and coin launches to industry events and technical developments, we cover all facets of the digital asset space with unwavering commitment to timely, relevant information.

Related Articles


- Prediction Market News: Kalshi Faces New Lawsuit Amid State Regulatory Crackdown
- Will Bitcoin Crash To $58k or Rally to $75k After Hot PCE Inflation Data?
- Ripple’s RLUSD Gets Institutional Boost as SEC Eases Stablecoin Rules for Broker-Dealers
- Crypto Market Weekly Recap: BTC Waver on Macro & Quantum Jitters, CLARITY Act Deadline Fuels Hope, Sui ETFs Go Live Feb 16-20
- Robert Kiyosaki Adds To Bitcoin Position Despite Market Decline
- XRP Price Prediction As SBI Introduces Tokenized Bonds With Crypto Rewards
- Ethereum Price Rises After SCOTUS Ruling: Here’s Why a Drop to $1,500 is Possible
- Will Pi Network Price See a Surge After the Mainnet Launch Anniversary?
- Bitcoin and XRP Price Prediction As White House Sets March 1st Deadline to Advance Clarity Act
- Top 3 Price Predictions Feb 2026 for Solana, Bitcoin, Pi Network as Odds of Trump Attacking Iran Rise
- Cardano Price Prediction Feb 2026 as Coinbase Accepts ADA as Loan Collateral


