Can This Upcoming Trendline Prevent Further Downfall In Ethereum Price?


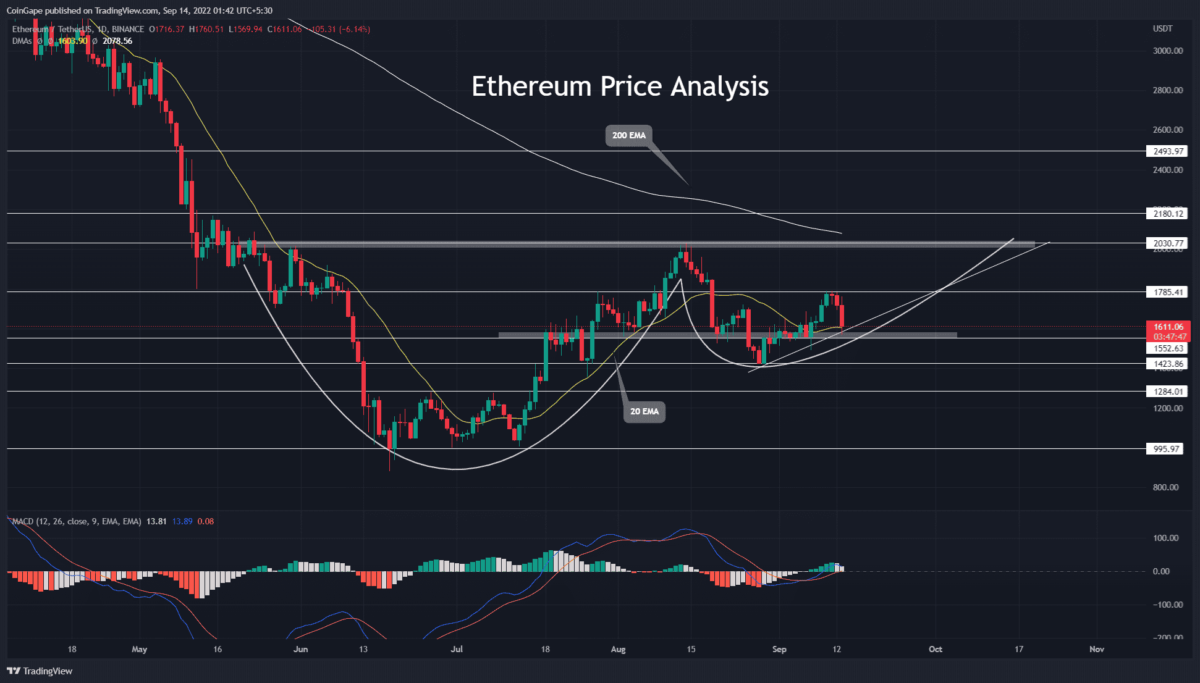
The daily ETH/USDT technical chart shows the formation of a cup and handle pattern. In response to this pattern, the coin price should follow an uptrend direction and break the neckline resistance of $2000. By doing so, the Ethereum price would obtain an early signal for trend reversal which could grab the first target of $2500. However, the coin price currently trades at $1575 and 8% down on the intraday level.
Key points from Ethereum price analysis:
- The Ethereum price has lost 11% in the last three days.
- An upcoming support trendline may assist buying to maintain a recovery rally.
- The intraday trading volume in Ethereum is $22.5 Billion, indicating an insignificant rise of 22.8%.
 Source- Tradingview
Today’s sell-off initiated with the fresh data consumer price index(CPI), pointing to an 8.3% YoY inflation. However, the bearish momentum accelerated as the CME Fed Watch Tool showed a 20% chance of a 100 bps or 1% interest rate hike. Thus, the market sentiment is again in turmoil, and questioning has the bottom really formed.
Anyhow, the technical chart currently shows a bullish reversal pattern governing the Ethereum price action, and therefore, traders can keep a bullish outlook until they don’t lose the swing low support of $1430.
As of now, the bearish engulfing candle retests the combined support of $1550 and the upcoming support trendline. However, if today’s daily candle closes above this support, the price holds a recovery opportunity.
A possible reversal from this concentrated support will surge the altcoin 28% higher to hit the neckline of the aforementioned pattern.
On a contrary note, if the selling pressure persists and the daily candle closes below $1550, the price will fall to $1430 and attempt to breach it
Technical indicator-
MACD indicator: the fast and slow lines wavering exactly over the mid-zone indicates a neutral sentiment among the market participants.
EMAs: it seems the EMAs have marked the crucial level of technical chart offering weightage to those levels. Thus, the 20-day EMA at $1550 support assists buying to sustain the bullish pattern. Moreover, the 200-day EMA at $2000 resistance creates an additional barrier against bulls.
- Resistance level- $1785 and $2000
- Support level- $1550 and $1430

Why Trust CoinGape
CoinGape has covered the cryptocurrency industry since 2017, aiming to provide informative insights Read more…to our readers. Our journal analysts bring years of experience in market analysis and blockchain technology to ensure factual accuracy and balanced reporting. By following our Editorial Policy, our writers verify every source, fact-check each story, rely on reputable sources, and attribute quotes and media correctly. We also follow a rigorous Review Methodology when evaluating exchanges and tools. From emerging blockchain projects and coin launches to industry events and technical developments, we cover all facets of the digital asset space with unwavering commitment to timely, relevant information.

Related Articles


- Ripple’s RLUSD Gets Institutional Boost as SEC Eases Stablecoin Rules for Broker-Dealers
- Crypto Market Weekly Recap: BTC Waver on Macro & Quantum Jitters, CLARITY Act Deadline Fuels Hope, Sui ETFs Go Live Feb 16-20
- Robert Kiyosaki Adds To Bitcoin Position Despite Market Decline
- XRP News: Ripple Partner SBI Reveals On-Chain Bonds That Pay Investors in XRP
- BitMine Ethereum Purchase: Tom Lee Doubles Down on ETH With $34.7M Fresh Buy
- XRP Price Prediction As SBI Introduces Tokenized Bonds With Crypto Rewards
- Ethereum Price Rises After SCOTUS Ruling: Here’s Why a Drop to $1,500 is Possible
- Will Pi Network Price See a Surge After the Mainnet Launch Anniversary?
- Bitcoin and XRP Price Prediction As White House Sets March 1st Deadline to Advance Clarity Act
- Top 3 Price Predictions Feb 2026 for Solana, Bitcoin, Pi Network as Odds of Trump Attacking Iran Rise
- Cardano Price Prediction Feb 2026 as Coinbase Accepts ADA as Loan Collateral


