 Buy $GGs
Cardano Price Analysis: ADA Finds Support Near $0.43; Is Bounce Back Possible?


Cardano price analysis indicates a downside moment for the day. The price traded in the red for the past few hours. However, reliable short-term support formed near the $0.43 zone as the price bounced back toward $0.45 recovering part of its daily losses.
However, the overall market remains bearish, and a further drop below $0.40 could not be ruled out.
As of press time, ADA/USD is reading at $0.45, down 2.35% for the day. Over the 24 hours, the trading volume dropped marginally to $717,338,715 as per the CoinMarketCap data. The current market cap stands at $15,308,094,431, making it the eighth largest crytpocurrency.
- Cardano’s price drops marginally lower as the fresh trading begins.
- The formation of multiple ‘Doji’ candlesticks near $0.43, makes bulls hopeful for a swift recovery.
- Technical indicator warns of aggressive bids before confirmation of the fresh directional setup.
Cardano price stabilize near $0.45
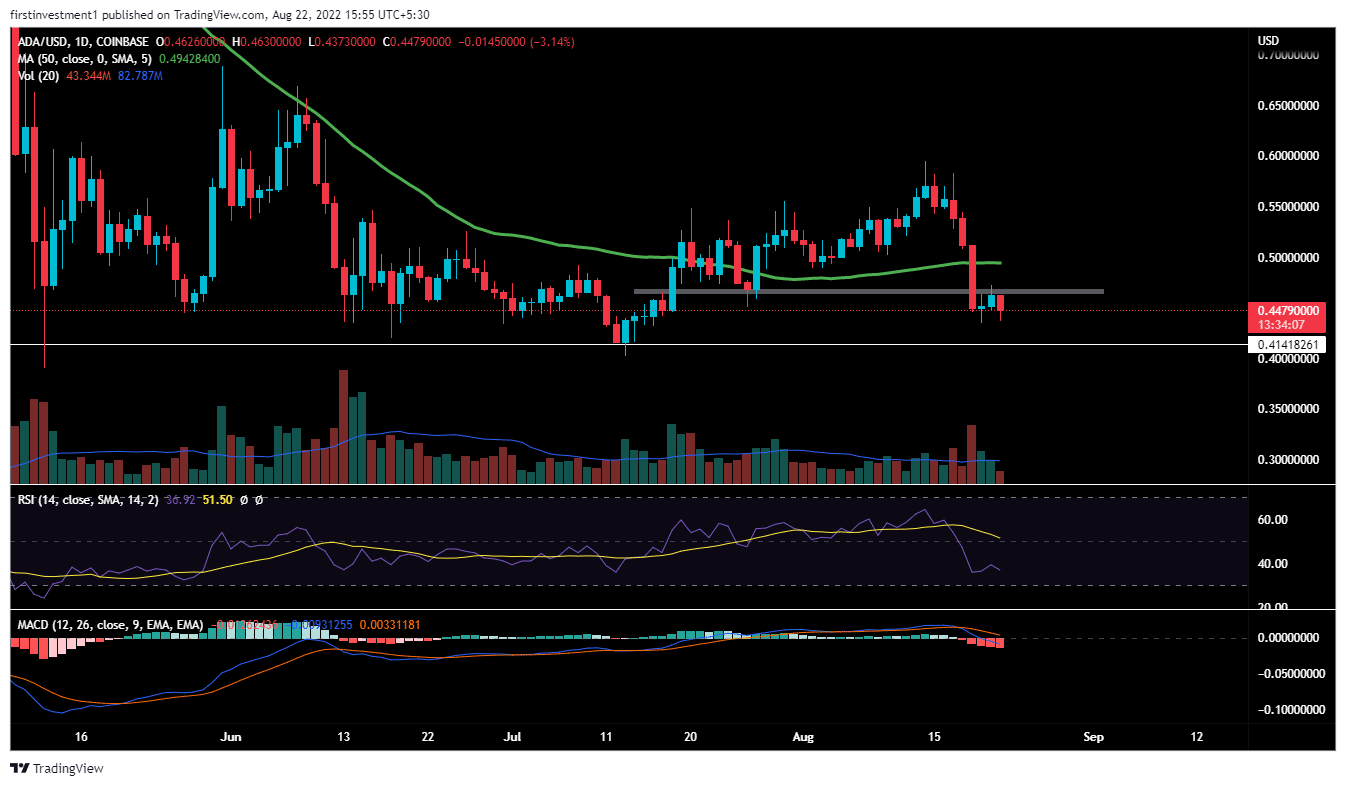
On the daily chart, the Cardano price analysis shows an interim consolidation zone.
Recently, ADA fall more than 20% in just three trading days and is now consolidating near recent lows.
The price s forming an inside candle formation pattern, which is mainly a consolidating before then the big move to its continued trend, which is in case it is bearish.
On Aug 19, the price fell sharply nearly by 12%, breachign the short-term horizontal support zone. Further, it marked the breaking of the 50-day exponential moving, along with its previous swing low. The nearest support for ADA is at $0.43, whereas the most immediate resistance is at $0.46. There is a higher probability of price testing its resistance first, however, it would be interesting to watch if it could break the upside barricade.
So there is an opportunity to take i.e. “Sell on Rising” near the resistance. Although, If the price breaks its support level, firstly, then also we can enter into a short trade.
The RSI (14) is trading below 50. When the relative strength index is below 50, it generally means that the losses are greater than the gains. Whereas, the MACD line crosses below the signal line below zero, indicating a bearish trend.
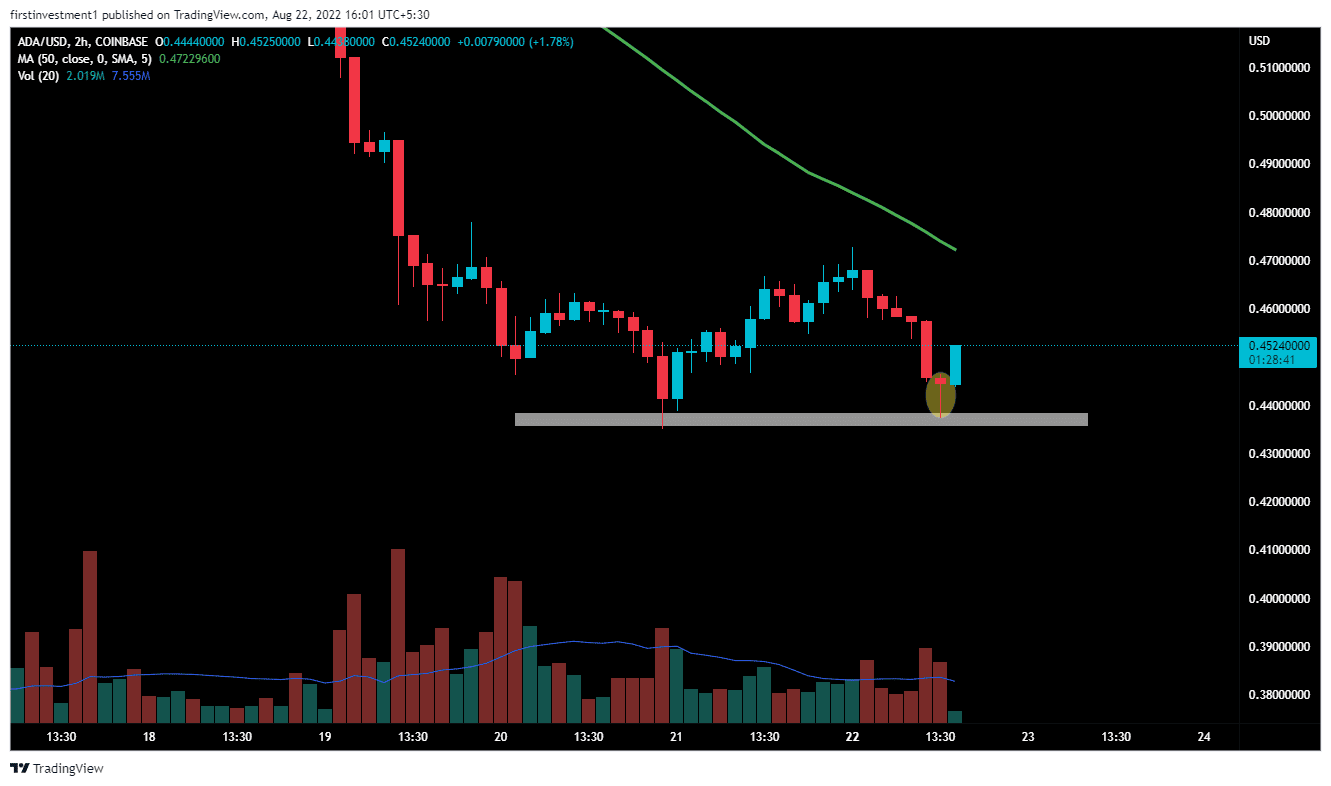
ADA on the two-hour chart, formed a “Double Bottom” pattern, along with a bullish Hammer candlestick pattern, indicating a possible reversal from its lows.
If the price closes above $0.45, on the two-hour chart, we can expect a short-term reversal, which will be good for shorting on higher levels. Further, a break above the $0.4715 level amid sustained buying momentum could invalidate the bearish outlook. And the price can move toward $0.50.
On the other hand, a spike in sell order with prices dropping below $0.43 would be favorable conditions for the bears.
ADA is slightly bearish on all time frames. Below $0.43 closing on the daily time frame, we can put a trade on the sell side.
Play 10,000+ Casino Games at BC Game with Ease
- Instant Deposits And Withdrawals
- Crypto Casino And Sports Betting
- Exclusive Bonuses And Rewards


Why Trust CoinGape
CoinGape has covered the cryptocurrency industry since 2017, aiming to provide informative insights Read more…to our readers. Our journal analysts bring years of experience in market analysis and blockchain technology to ensure factual accuracy and balanced reporting. By following our Editorial Policy, our writers verify every source, fact-check each story, rely on reputable sources, and attribute quotes and media correctly. We also follow a rigorous Review Methodology when evaluating exchanges and tools. From emerging blockchain projects and coin launches to industry events and technical developments, we cover all facets of the digital asset space with unwavering commitment to timely, relevant information.

Related Articles


- CFTC Chief Mike Selig Signals US Crypto Perpetual Futures Rollout in Coming Weeks
- Fed Rate Cut Odds Drop as Inflation Fears Rise Due To U.S. Iran Conflict
- Here’s Why Tether Gold (XAUt) Price Is Falling Even With Growing Gold Demand
- XRP News: Ripple Expands Payments Platform To Unify Fiat and Stablecoins Globally
- U.S.–Iran War: Bitcoin Price Extends Decline as Oil Prices Surge To Two-Year High
- Gold Price Prediction March 2026: Rally, Crash, or Record Highs?
- RIOT Stock Prediction as Needham, Piper Sandler Slash Target After Earnings
- Cardano Price Outlook As Charles Hoskinson Warns Over CLARITY Act
- Circle Stock Price Climbs 15% to $96, Can Rally Continue in March 2026?
- Bitcoin Price Prediction as US-Iran War Enters 4th Consecutive Day
- Top 5 Historical Reasons Dogecoin Price Is Not Rising


