
Cardano Price Analysis: Fake Breakdown Sparks Hope for 26% Recovery


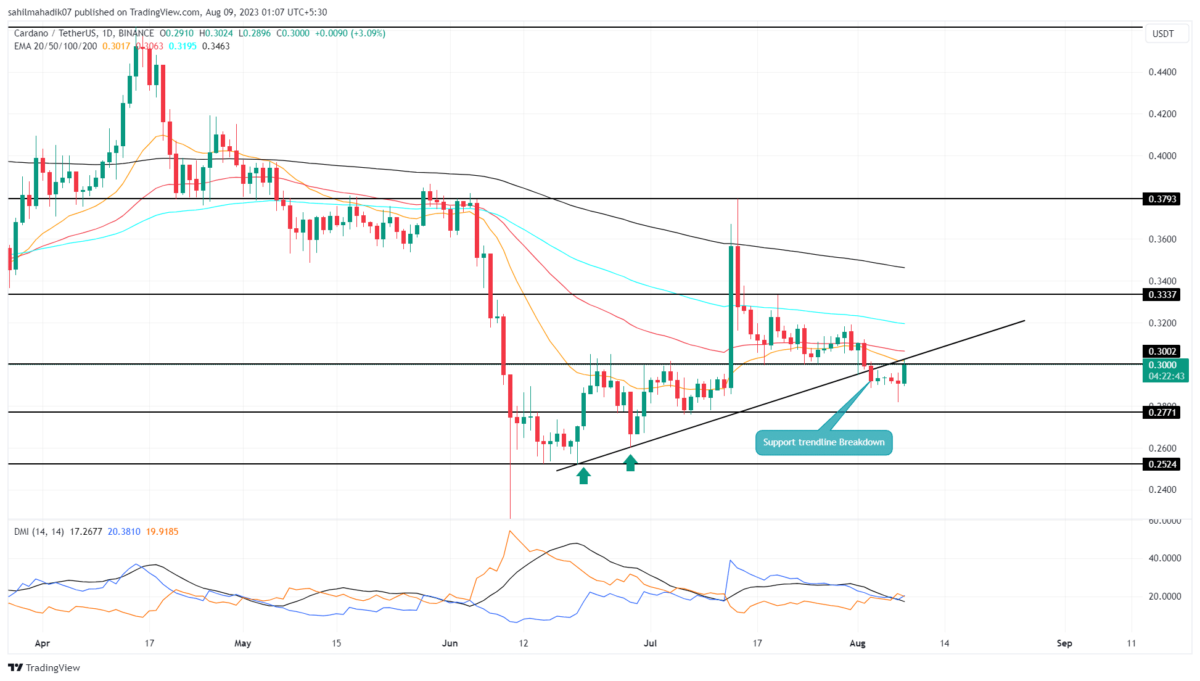
Cardano Price Analysis: On August 3rd, the falling Cardano price gave a bearish breakdown from the combined support of $0.3 and support trendline. Amid the increased uncertainty, this crackdown was expected to trigger a significant correction but the prices went sideways reflecting weakness in bearish momentum. Will buyers take advantage of the ongoing consolidation to kickstart a new recovery cycle?
Also Read: Cardano (ADA) to Expand Mithril Access Via New Partnership
Cardano Price Daily Chart
- The daily chart reflects a fake breakdown from the rising support trendline
- A decisive breakout from the overhead trendline would set the Cardano price for a 26% upswing
- The intraday trading volume in the ADA coin is $300.6 Million, indicating an 18% gain.
 Source- Tradingview
Despite the recent breakdown of the rising support trendline, the ADA sellers failed to push the prices lower. The daily chart of August 7th, gives a clear few of active accumulation at the bottom, as the price candle shows a long-tail lower price rejection.
Today, the Cardano price surged 3.23% and reached the current trading price of $0.3. If the buyers manage to reclaim the breached support with a daily candle closing above, the prior breakdown would be marked as a bear trap.
This is a deceptive situation because it lures traders into making pessimistic decisions based on the apparent downtrend, only for the market dynamics to shift in the opposite direction. The potential breakout would be a strong signal for recovery and bolster prices for 26% higher to hit $0.38.
Can ADA Buyers Still Manage to Reclaim $0.3?
The anticipated rally would bolster the formation of a double bottom pattern developing in the daily time frame chart. This pattern reflects high accumulation from buyers, usually leading to a strong upswing. Under the influence of this chart setup, the coin price is set for a rally of $0.46.
- Exponential Moving Average: The daily EMAs(20, 50, 100, and 200) moving higher to ADA price could create additional barriers for trades.
- Direction Moving Average: A potential bullish crossover between the DI+(blue) and DI-(orange) slope would signal the increasing buying pressure in the market.
Play 10,000+ Casino Games at BC Game with Ease
- Instant Deposits And Withdrawals
- Crypto Casino And Sports Betting
- Exclusive Bonuses And Rewards


Why Trust CoinGape
CoinGape has covered the cryptocurrency industry since 2017, aiming to provide informative insights Read more…to our readers. Our journal analysts bring years of experience in market analysis and blockchain technology to ensure factual accuracy and balanced reporting. By following our Editorial Policy, our writers verify every source, fact-check each story, rely on reputable sources, and attribute quotes and media correctly. We also follow a rigorous Review Methodology when evaluating exchanges and tools. From emerging blockchain projects and coin launches to industry events and technical developments, we cover all facets of the digital asset space with unwavering commitment to timely, relevant information.


- TRUMP Coin Jumps as Team Announces Conference With President Trump as Keynote Speaker
- Breaking: Trump Calls For Emergency Fed Rate Cut Before Next Week’s FOMC Meeting
- Breaking: U.S. Senate Passes Bipartisan Housing Bill That Includes CBDC Ban
- Crypto Market Rebounds as Trump Mulls Suspending Jones Act to Ease Oil Price Pressures
- Goldman Sachs Revises Fed Rate Cut Forecast to September as Iran War Threatens Inflation
- COIN Stock Prediction as Crypto Crash Odds Jump as Expert Sees Inflation Hitting 3.4%
- Cardano Price Turns Bullish as ADA Futures OI Hits $416M Ahead Of Key Upgrades
- Dogecoin Price Outlook If Elon Musk’s X Money Integrates Crypto- Is $0.2 Possible This Week?
- Will XRP Price Rally After Ripple’s Strategic Acquisition in Australia?
- Bitcoin Price At Risk of Losing $65k as Iran Warns of “Continuous Strikes” That May Push Oil to $200
- XRP Price Prediction as Goldman Sachs Becomes Biggest Holder of Ripple ETFs


