Cardano Price Analysis: Is $ADA Price Ready to Reclaim $0.4 Mark?


Cardano Price Analysis: Today, the crypto market experienced increased selling pressure, leading to a downward trend in several major cryptocurrencies. As a result, the Cardano price is down 1.22% and is approaching the support trendline of the rising channel pattern. Historically, this ascending trendline has acted as an active accumulation zone for traders which usually results in a massive recovery cycle.
Also Read: Cardano Price Prediction 2023, 2025, 2030: ADA signals for upcoming surge
Cardano Price Daily Chart
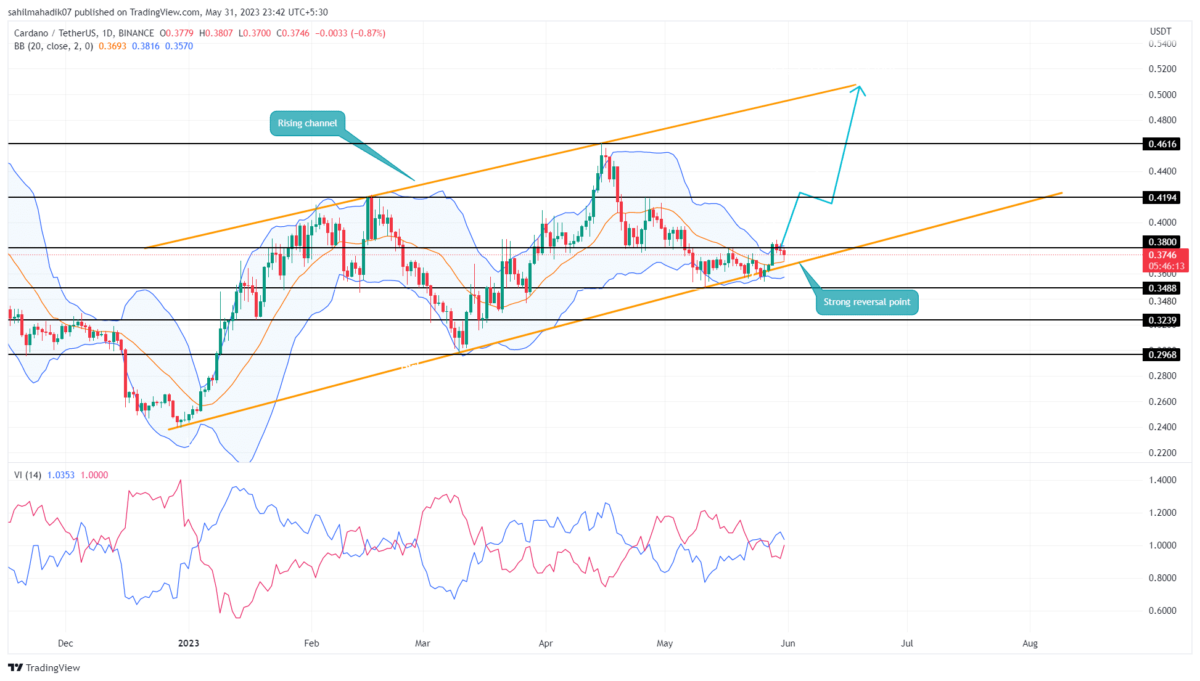
- The Cardano coin price maintains an overall bullish trend until the channel pattern is intact
- A breakdown below the lower trendline will signal the resumption of the prior downtrend
- The intraday trading volume in the ADA coin is $189.5 Million, indicating an 0.97% gain
 Source- Tradingview
On May 28th, the ADA price gave a bullish breakout from a local resistance of $0.38 in anticipation of kickstarting a new recovery rally. However, with the increasing selling pressure in the market, the buyers failed to sustain this level and plunged below $0.38 again.
This breakdown plummeted Cardano coin price to $0.37 and is likely to tumble another 2% to hit the ascending trendline. Over the last five months, altcoin has rebounded from this support thrice indicating a strong buying zone.
Thus, the ADA price is likely to bounce off this level and recuperate the bullish momentum. If a potential reversal occurs, the buyers may drive the prices to reach $0.42, followed by $0.46, and $0.5.
Will Cardano Price Tag $0.4 Mark?
A potential bullish reversal from the support trendline will recuperate the bullish momentum in ADA price. In theory, a reversal from a lower trendline bolsters buyers to carry a recovery cycle back to the upper trendline. Thus, the resulting recovery may push the Cardano price to the first target of $0.42.
- Bollinger band: The bands of the BB indicator squeezed significantly indicate the ADA price is currently in a highly volatile phase.
- Vortex Indicator: The VI+(blue) and VI-(orange) slope in a bullish crossover state reflect the market trend is bullish.

Why Trust CoinGape
CoinGape has covered the cryptocurrency industry since 2017, aiming to provide informative insights Read more…to our readers. Our journal analysts bring years of experience in market analysis and blockchain technology to ensure factual accuracy and balanced reporting. By following our Editorial Policy, our writers verify every source, fact-check each story, rely on reputable sources, and attribute quotes and media correctly. We also follow a rigorous Review Methodology when evaluating exchanges and tools. From emerging blockchain projects and coin launches to industry events and technical developments, we cover all facets of the digital asset space with unwavering commitment to timely, relevant information.

Related Articles


- “Sell Bitcoin Now,” Peter Schiff Projects Further BTC Price Crash to $20k
- 8 Best Decentralized Crypto Banking Solutions in 2026 – Top List Reviewed
- Top 8 Companies Leading the Tech and Compliance for RWA Tokenization
- US PCE Inflation Estimates by JPMorgan, BofA, & Other Wall Street Banks
- CLARITY Act: Banks and Crypto Make Progress Following “Constructive” Dialogue at White House Meeting
- Top 3 Price Predictions Feb 2026 for Solana, Bitcoin, Pi Network as Odds of Trump Attacking Iran Rise
- Cardano Price Prediction Feb 2026 as Coinbase Accepts ADA as Loan Collateral
- Ripple Prediction: Will Arizona XRP Reserve Boost Price?
- Dogecoin Price Eyes Recovery Above $0.15 as Coinbase Expands Crypto-Backed Loans
- BMNR Stock Outlook: BitMine Price Eyes Rebound Amid ARK Invest, BlackRock, Morgan Stanley Buying
- Why Shiba Inu Price Is Not Rising?


