 Claim Card
Cardano Price Analysis: Potential Reversal Ahead as Multiple Supports Hold Firm at $0.3


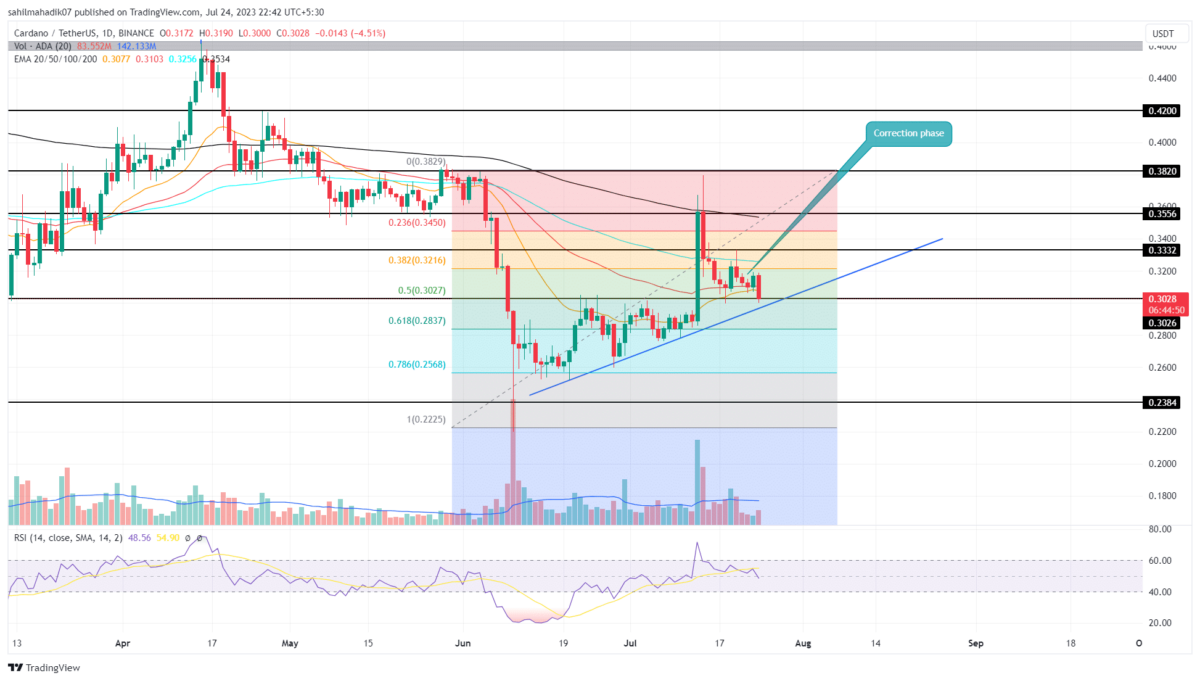
Cardano Price Analysis: While the crypto market leaders, Bitcoin and Ethereum are trapped in uncertainty, the 7th largest cryptocurrency Cardano struggles in a correction phase. Within a fortnight the coin price plunged from $0.379 to a current price of $0.3, registering a 21% loss. The buyers facing a challenge to build bullish momentum for a bounce back, indicating the ADA price could witness a longer correction.
Also Read: Cardano’s Light Wallet Lace Gets Crucial Updates
Cardano Price Daily Chart
- The $0.3 aligned with other technical support creates a high area of interest(AOI)
- A Cardano price above 50% retracement level indicates the overall market trend bullish
- The intraday trading volume in the ADA coin is $236.6 Million, indicating a 32% gain.
 Source- Tradingview
Over the week, the Cardano price showed two failed attempts to rebound from the $0.3 psychological support with the morning star candle pattern. This candle setup is an excellent sign of reversal but the lack of substantial follow-through from buyers raises concerns about their commitment for recovery.
Despite the challenges, the ongoing recovery in ADA price is expected to persist as long as the ascending trendline remains intact. The dynamic support, which has been maintaining a pattern of higher highs and lows for over a month, could provide additional strength for a recovery push.
The anticipated reversal should offer a breakout above the immediate resistance of $0.334 to signal uptrend continuation. If the bullish momentum persists, the Cardano price could surpass the $0.35 barrier, followed by $0.382, and $0.42.
Will ADA Price Fall Back to $0.26?
In case the increasing uncertainty leads to negative sentiment in the market, the Cardano price could give a breakdown below the lower trendline. A daily closing below the dynamic support will offset the recovery phase and pull the altcoin price back to $0.26.
- Relative Strength Index: The daily-RSI slope falling the 50% midline indicates the weakening bullish momentum and a higher possibility for breakdown.
- Exponential Moving Average: The 100-and-200-day EMA continues to offer dynamic resistance to rising coin prices.

Why Trust CoinGape
CoinGape has covered the cryptocurrency industry since 2017, aiming to provide informative insights Read more…to our readers. Our journal analysts bring years of experience in market analysis and blockchain technology to ensure factual accuracy and balanced reporting. By following our Editorial Policy, our writers verify every source, fact-check each story, rely on reputable sources, and attribute quotes and media correctly. We also follow a rigorous Review Methodology when evaluating exchanges and tools. From emerging blockchain projects and coin launches to industry events and technical developments, we cover all facets of the digital asset space with unwavering commitment to timely, relevant information.

Related Articles


- Expert Predicts Deeper Bitcoin Decline as JPMorgan CEO Warns of Similarities to the 2008 Financial Crisis
- Trump Won’t Pardon FTX’s Sam Bankman-Fried (SBF), White House Says
- Third Spot SUI ETF Goes Live as 21Shares Fund Launches on Nasdaq
- Mark Zuckerberg’s Meta Reportedly Eyes Stablecoin Integration This Year Amid Regulatory Clarity
- Coinbase Rivals Robinhood As It Rolls Out Stocks, ETFs Trading In ‘Everything Exchange’ Push
- Cardano Price Signals Rebound as Whales Accumulate 819M ADA
- Sui Price Eyes Recovery as Third Spot SUI ETF Debuts on Nasdaq
- Pi Network Price Eyes a 30% Jump as Migrations Jumps to 16M
- Will Ethereum Price Dip to $1,500 as Vitalik Buterin Continues Selling ETH?
- XRP Price Outlook as Clarity Act Passage Odds Plunge to 53%
- COIN Stock Risks Crashing to $100 as Odds of US Striking Iran Jump


