
Cardano Price Analysis: Will $ADA Price Lose $0.26 Support Amid Market Sell-off?


In the daily time frame chart, the Cardano price shows the formation of a double top pattern, a technical setup often seen before significant downward movement. With the peaks formed at the $0.30 mark, a breakthrough above this resistance could potentially ignite a strong bullish rally. However, the top forming in the chart reveals a potentially bearish phase ready to unfold.
Also Read: Cardano (ADA) Locked in DeFi Protocols Hits ATH
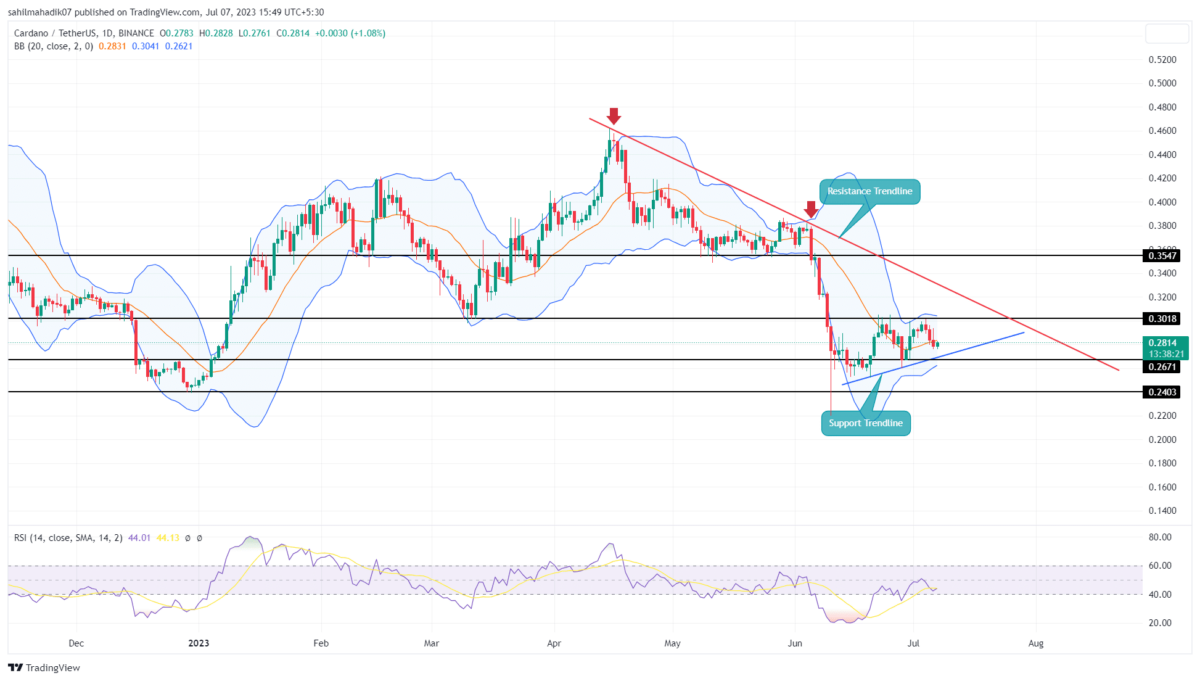
Cardano Price Daily Chart
- A breakdown below $0.26 could trigger a downfall in the ADA price
- The uptick in the lower Bollinger band along with daily gains reflects underlying bullish support.
- The intraday trading volume in the ADA coin is $232 Million, indicating a 13% loss
 Source- Tradingview
The Cardano price finds a gain of 1.79% after the three consecutive bearish candles that have shown a significant rejection of higher prices. Moreover, the chart suggests the formation of a double top pattern at $0.30 with a neckline at $0.26.
A short support trend line is also in action, a diagonal line drawn on the price chart connecting a sequence of low points. Interestingly, a long-standing resistance line is evident, persisting since the price failed to surpass $0.45. This creates a symmetrical triangle pattern in the daily chart.
If the price falls below this level, it could potentially reach $0.239. This level is critical to monitor, as a break below the neckline would confirm the double top pattern, indicating a bearish reversal.
Conversely, the formation of a bullish candle on the daily chart suggests a high likelihood of a sideways movement until the price reaches the resistance trend line.
Will ADA Price Sustain Above $0.26?
The formation of a double top in the Cardano coin reflects a bearish comeback as the profit booking after the short recovery accelerates the selling spree. This may eventually lead to an $0.26 breakdown. However, the 1.79% gain in the last 24 hours and the support trendline forming the triangle in the daily chart project a potential sideways trend in Cardano price until it reaches the resistance trendline.
- Bollinger Bands: A remarkable uptick in the lower band of the Bollinger Bands suggests a strong underlying bullish pressure, ready to absorb the double top breakout.
- Relative Strength Index: With the anticipated reversal, the daily RSI slope remains stagnant close to the halfway line, after an ascent from the oversold zone.

Why Trust CoinGape
CoinGape has covered the cryptocurrency industry since 2017, aiming to provide informative insights Read more…to our readers. Our journal analysts bring years of experience in market analysis and blockchain technology to ensure factual accuracy and balanced reporting. By following our Editorial Policy, our writers verify every source, fact-check each story, rely on reputable sources, and attribute quotes and media correctly. We also follow a rigorous Review Methodology when evaluating exchanges and tools. From emerging blockchain projects and coin launches to industry events and technical developments, we cover all facets of the digital asset space with unwavering commitment to timely, relevant information.


