Cardano Price Could Surge 17.5% on this Breakout; Buy Today?


In the daily time frame chart, the Cardano price showed silent recovery under the influence of a rising trendline. The buyers obtaining dynamic support from this trendline show new higher lows to restore the recovery sentiment back in the seventh largest cryptocurrency. However, as the crypto market leaders Bitcoin and Ethereum witness a setback in the past few weeks, the ADA buyers are struggling to surpass the $0.3 psychological barrier.
Also Read: New Cardano Hydra-Backed Decentralized Payment Service Teased
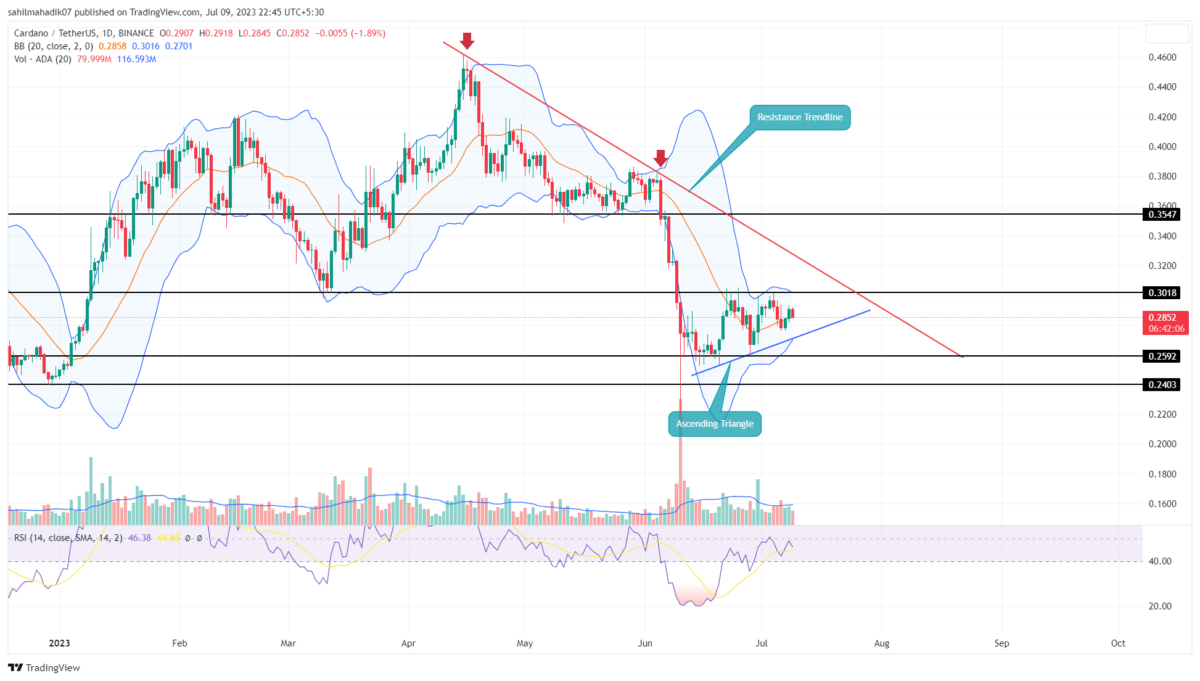
Cardano Price Daily Chart
- The formation of ascending triangle sets the ADA price to prolong the bullish recovery
- A breakout above the overhead trendline could signal a change in the price trend
- The intraday trading volume in the ADA coin is $189.6 Million, indicating a 6.5% loss
 Source- Tradingview
By press time, the Cardano price trades at $0.285 and shows an intraday loss of 1.62%. With the current volatility in the market, the coin price is wobbling between the chart levels which are the $0.3 resistance level and the rising support trendline.
In the daily chart, this price reflects the formation of a known continuation pattern called ascending triangle. In response to this chart pattern, the coin price is likely to rise higher and challenge the $0.3 psychological barrier.
However, this resistance is aligned with a downsloping trendline creating a high supply zone against buyers. Having said that, if the bullish momentum persists, a breakout above this combined resistance with candle closing will signal a strong buy signal for interested traders.
The post-breakout rally may surge the ADA price by 17.5% to hit the $0.345 mark.
Can ADA Price Plunge to $0.24?
Though the ascending triangle pattern commonly triggers a significant upswing, there are rare cases where the sellers can take control if the asset price breaks the support trendline. If market sentiment worsens, the ADA price may show a breakdown from the lower trend as a signal to invalidate bullish these. This crackdown could push the price back to $0.24.
- Bollinger Bands: The Bollinger band shrinking reflects uncertainty among market participants and therefore need for a directional move like a breakout to determine future trends.
- Relative Strength Index: The daily RSI slope rising but price action making the same high indicates buyers’ attempts are not having a significant impact and thus a sense of weakness in ADA price.

Why Trust CoinGape
CoinGape has covered the cryptocurrency industry since 2017, aiming to provide informative insights Read more…to our readers. Our journal analysts bring years of experience in market analysis and blockchain technology to ensure factual accuracy and balanced reporting. By following our Editorial Policy, our writers verify every source, fact-check each story, rely on reputable sources, and attribute quotes and media correctly. We also follow a rigorous Review Methodology when evaluating exchanges and tools. From emerging blockchain projects and coin launches to industry events and technical developments, we cover all facets of the digital asset space with unwavering commitment to timely, relevant information.

Related Articles


- Metaplanet CEO Simon Gerovich Defends Bitcoin Strategy Amid Anonymous Allegations
- “Sell Bitcoin Now,” Peter Schiff Projects Further BTC Price Crash to $20k
- 8 Best Decentralized Crypto Banking Solutions in 2026 – Top List Reviewed
- Top 8 Companies Leading the Tech and Compliance for RWA Tokenization
- US PCE Inflation Estimates by JPMorgan, BofA, & Other Wall Street Banks
- Bitcoin and XRP Price Prediction As White House Sets March 1st Deadline to Advance Clarity Act
- Top 3 Price Predictions Feb 2026 for Solana, Bitcoin, Pi Network as Odds of Trump Attacking Iran Rise
- Cardano Price Prediction Feb 2026 as Coinbase Accepts ADA as Loan Collateral
- Ripple Prediction: Will Arizona XRP Reserve Boost Price?
- Dogecoin Price Eyes Recovery Above $0.15 as Coinbase Expands Crypto-Backed Loans
- BMNR Stock Outlook: BitMine Price Eyes Rebound Amid ARK Invest, BlackRock, Morgan Stanley Buying


