 Buy $GGs
ADA Price Revisits $0.24 Multi Month Support; Will it Rebound?


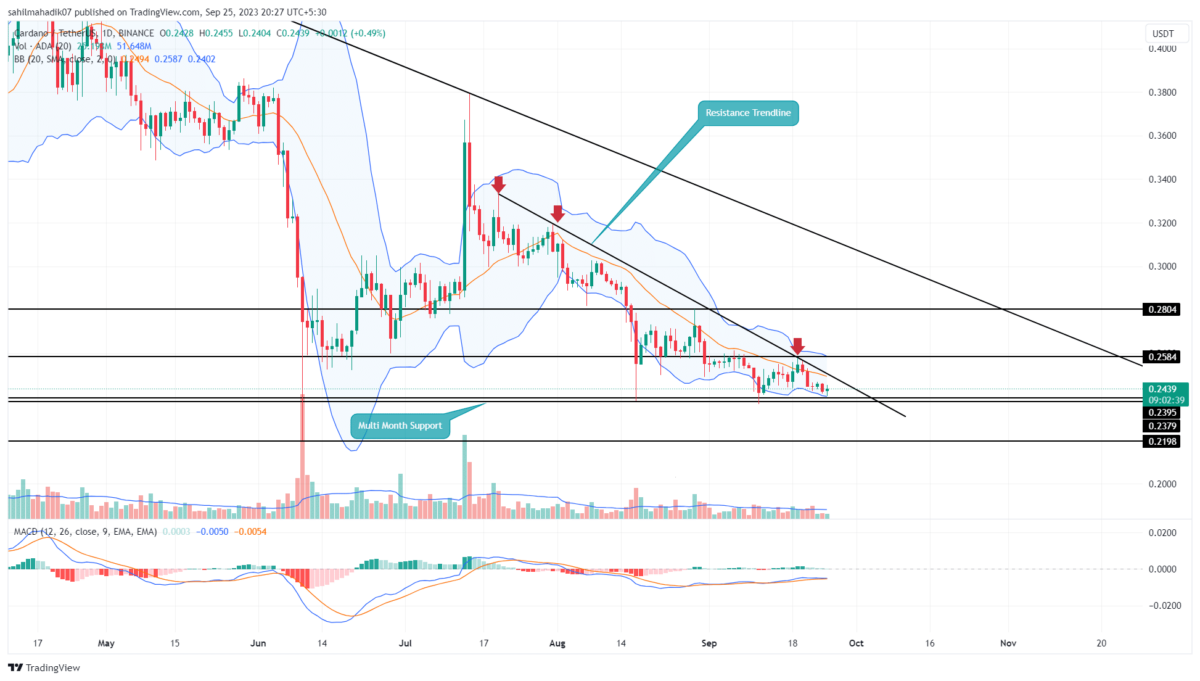
The Cardano price experienced a mixed sentiment throughout September, mostly oscillating within a narrow band on the daily chart. With increasing selling pressure, it repeatedly met resistance around the $0.26 mark and found consistent support near the $0.24 level. The recent downtrend in the broader crypto market has once again driven ADA to test its longstanding support at $0.24, signaling another potential bounce.
Also Read: Cardano Project Catalyst Wraps Up Fund 10, Here are Key Takeaways
Will ADA Price Defend $0.24?
- A bullish breakout from the resistance trendline will be an early signal for trend reversal
- The $0.24 has remained a strong support zone for Cardano traders.
- The intraday trading volume in the ADA coin is $87 Million, indicating a 23% loss
 Source- Tradingview
On September 28th, the ADA price experienced resistance from a descending trendline, a prominent feature governing the recent corrective phase. Over the past week, this downward pressure caused this altcoin to shed 5% of its value, nudging it toward the $0.24 support zone.
This particular support level has held firm for nearly three years, making it a significant accumulation point for investors. The recent daily candle, with a modest 0.4% gain, indicates a neutral stance. This suggests that the strong bearish sentiment might be dissipating, as traders recognize renewed buying interest around the $0.24 mark.
Should this buying pressure continue, the ADA price might attempt to breach the descending resistance trendline, potentially signaling the beginning of a bullish recovery
If Cardano coin manages to surpass this key resistance, the buyers may drive the prices upwards by roughly 6%, targeting the significant resistance at $0.25. A continuation of this upward move could further propel the coin towards the $0.28 mark.
[converter id=”ada-cardano” url=”https://coingape.com/price/converter/cardano-to-usd/?amount=1″]
ADA vs BTC Performance
 Source: Coingape| Cardano Vs Bitcoin Price
The last six months’ price behavior has showcased weakness in Cardano coin in comparison with Bitcoin price. While BTC has been trading new sideways for the past six months, the ADA price has witnessed a steady downtrend. This established downward trajectory indicates it is a risky asset to invest.
- Moving Average Convergence Divergence: A potential bearish crossover between the MACD(blue) and signal(orange) will prolong the correction trend.
- Bollinger Band: The lower band of the Bollinger Band indicator offers additional support to buyers.
Play 10,000+ Casino Games at BC Game with Ease
- Instant Deposits And Withdrawals
- Crypto Casino And Sports Betting
- Exclusive Bonuses And Rewards


Why Trust CoinGape
CoinGape has covered the cryptocurrency industry since 2017, aiming to provide informative insights Read more…to our readers. Our journal analysts bring years of experience in market analysis and blockchain technology to ensure factual accuracy and balanced reporting. By following our Editorial Policy, our writers verify every source, fact-check each story, rely on reputable sources, and attribute quotes and media correctly. We also follow a rigorous Review Methodology when evaluating exchanges and tools. From emerging blockchain projects and coin launches to industry events and technical developments, we cover all facets of the digital asset space with unwavering commitment to timely, relevant information.
24 Hours volume
$867.05M
Market Cap
$10.74B
Max Supply
45B

Related Articles


- Peter Brandt Flips Bullish, Predicts Bitcoin Rally As Price Holds Above $70k
- XRP News: Institutional Use Case Expands as Doppler Finance Integrates WXRP for Multi-Chain Access
- Trump Tariffs: Bitcoin Faces Fresh Headwinds as 15% Global Tariffs Begin This Week Amid Iran War
- Bitget Unveils ‘Crypto Anti-Bias Pledge’ To Support Women’s Inclusion In Crypto
- U.S.-Iran War: Crypto Market Rebounds as Iran Reportedly Reaches Out To U.S. To End Conflict
- XRP Price Prediction as Iran-U.S. Peace Talks Trigger a Crypto Rally
- COIN Stock Analysis as Bitcoin Retests $72k Ahead of February NFP Data
- Robinhood Stock Price Prediction As Cathie Wood Buys $12M Dip in Bold ARK Move
- Bitcoin Price At Risk? Professor Who Predicted US-Iran War Says America Could Lose
- Gold Price Prediction March 2026: Rally, Crash, or Record Highs?
- RIOT Stock Prediction as Needham, Piper Sandler Slash Target After Earnings


