 Claim Card
Cardano Price Prediction As Next Leap May Push Recovery to $0.3


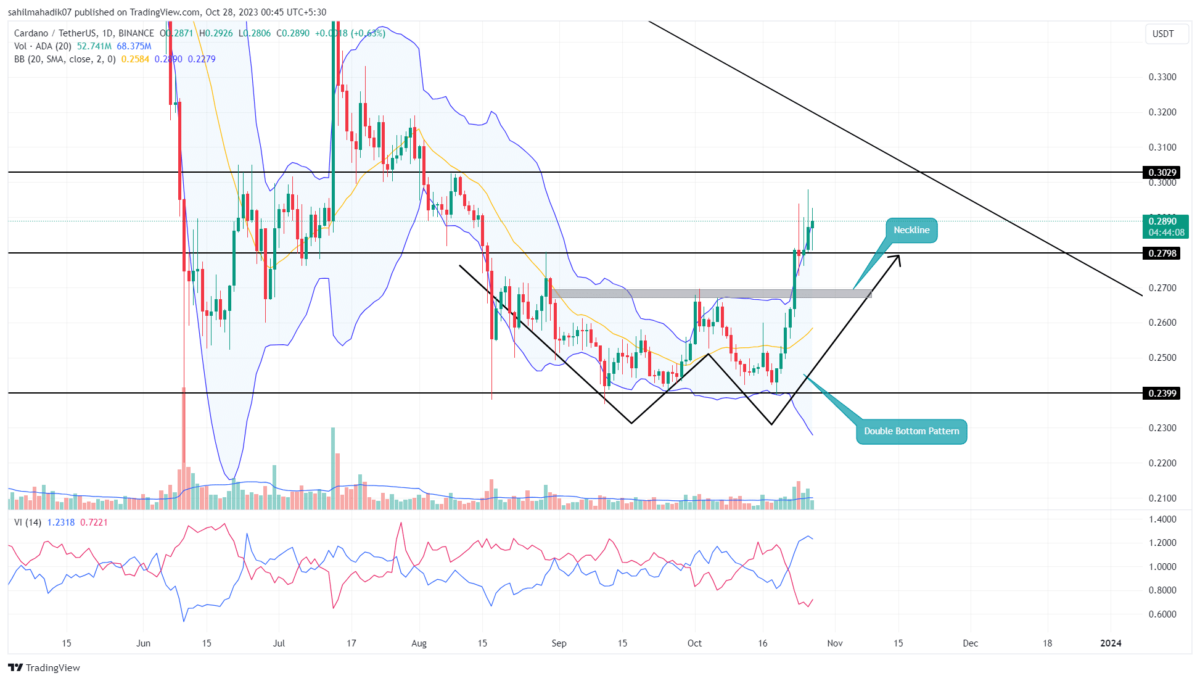
Cardano Price Prediction: While many cryptocurrencies have been part of the recent recovery rally, the ADA coin entered the game a bit later but has quickly made up for lost time. Starting from a solid support level of $0.24, the asset has surged by approximately 20%, currently trading at $0.286. Notably, this uptick also marked the completion of a bullish double-bottom pattern, suggesting the potential for further gains.
Also Read: ADA’s Bullish Potential Hinges on $0.40 Breakout for Rally Towards $1
Double Bottom Pattern Hints Further Rally.
- Overhead supply hints the ADA price could see a minor pullback before the next leap
- The $0.3 level aligned with a long-coming resistance hints at a high supply zone for traders.
- The intraday trading volume in the Caradno coin is $207 Million, indicating a 30% loss
 Source- Tradingview
On October 23rd, the Cardano price broke through the neckline resistance of the Double bottom pattern, signaling early indications of a sustainable recovery and infusing the market with bullish momentum.
Although the asset rallied to a high of $0.294 post-breakout, it couldn’t sustain these levels, likely due to the influence of the leading cryptocurrency Bitcoin struggling to break the $35,000 barrier. Consequently, the ADA price has seen multiple rejections candle around the $0.295 mark, hinting at an upcoming retracement.
This anticipated pullback could find support around the $0.28 level, followed by $0.268. Should the price stabilize above these points, it would provide a strong base for the next upward movement.
Will ADA Price Hit $0.3?
After the substantial gains over the past two weeks, a minor retracement is not only expected but healthy for sustaining longer-term bullish momentum. If the ADA price maintains levels above $0.28 or even $0.265, it would be well-positioned to complete the Double Bottom pattern, targeting the $0.3 mark—a potential gain of approximately 6% from current levels.
- Bollinger Band: An uptick in the upper band of the Bollinger Band indicator shows that buying pressure remains strong.
- Vortex Indicator: The VI+ (blue) line crossing above the VI- (pink) further affirms the asset’s bullish posture.

Why Trust CoinGape
CoinGape has covered the cryptocurrency industry since 2017, aiming to provide informative insights Read more…to our readers. Our journal analysts bring years of experience in market analysis and blockchain technology to ensure factual accuracy and balanced reporting. By following our Editorial Policy, our writers verify every source, fact-check each story, rely on reputable sources, and attribute quotes and media correctly. We also follow a rigorous Review Methodology when evaluating exchanges and tools. From emerging blockchain projects and coin launches to industry events and technical developments, we cover all facets of the digital asset space with unwavering commitment to timely, relevant information.
24 Hours volume
$379.4M
Market Cap
$10.38B
Max Supply
45B

Related Articles


- Expert Predicts Deeper Bitcoin Decline as JPMorgan CEO Warns of Similarities to the 2008 Financial Crisis
- Trump Won’t Pardon FTX’s Sam Bankman-Fried (SBF), White House Says
- Third Spot SUI ETF Goes Live as 21Shares Fund Launches on Nasdaq
- Mark Zuckerberg’s Meta Reportedly Eyes Stablecoin Integration This Year Amid Regulatory Clarity
- Coinbase Rivals Robinhood As It Rolls Out Stocks, ETFs Trading In ‘Everything Exchange’ Push
- Cardano Price Signals Rebound as Whales Accumulate 819M ADA
- Sui Price Eyes Recovery as Third Spot SUI ETF Debuts on Nasdaq
- Pi Network Price Eyes a 30% Jump as Migrations Jumps to 16M
- Will Ethereum Price Dip to $1,500 as Vitalik Buterin Continues Selling ETH?
- XRP Price Outlook as Clarity Act Passage Odds Plunge to 53%
- COIN Stock Risks Crashing to $100 as Odds of US Striking Iran Jump


