Cardano Price Prediction: Bullish Breakout at $0.278 Signals Potential 15% Surge


The Cardano coin has been in a correction phase since mid-July, showing a V-top reversal from $0.379. This downfall evaporated the entire gains of the June-July rally and plunged to a low of $0.283. As a result, the altcoin lost a market value of 36.5% before rebounding from the aforementioned low. Is this support enough to restore bullish momentum in ADA?
Also Read: Cardano Debuts New Hydra Version, ADA Price Pump Incoming?
Cardano Daily Chart: Key Points
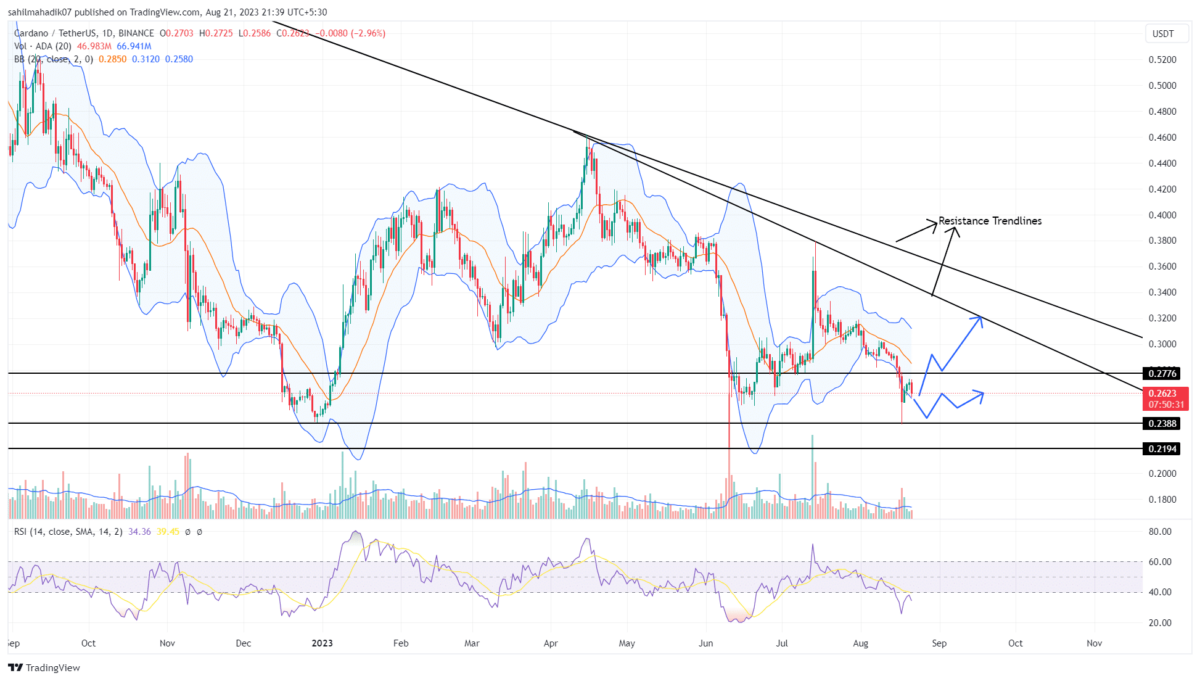
- A V-top reversal in ADA price indicates an aggressive selling momentum
- A bullish breakout from the $0.2785 barrier would set the ADA price for a 15% upswing
- The intraday trading volume in the ADA coin is $120.6 Million, indicating a 27% gain.
 Source- Tradingview
On August 17th, the ADA price showed a long-tail rejection candle at $0.283 support reflecting the buyers’ accumulation at a discounted price. The resulting reversal pushed the prices 12% higher and currently trading at $0.263.
With sustained buying, the coin price may rise higher and challenge the August 17th high of $0.2785. This candle associated with a huge surge in volume indicates a strong force from sellers to plunge the Cardano coin lower.
However, a breakout above this barrier will break the seller’s weapon and give buyers additional confirmation for recovery. The post-breakout rally could surge the prices by 15%, hitting a downsloping resistance trendline.
[converter id=”ada-cardano” url=”https://coingape.com/price/converter/cardano-to-usd/?amount=1″]
Can ADA Price Extend Correction Trend?
If the overall market trend remains bearish, the Cardano coin may face a bearish reversal from the $0.2785 resistance. The supply pressure could trigger a sideways trend above the $0.283 support. Under a pessimistic approach, a breakdown below the $x and $x barrier would trigger a massive correction in ADA price.
- Bollinger Band: The downtick in the lower band on the Bollinger band indicator projects the bearish momentum is still aggressive.
- Relative Strength Index: The daily RSI slope must break the 40% mark to reflect suitable bullish momentum for a rally.

Why Trust CoinGape
CoinGape has covered the cryptocurrency industry since 2017, aiming to provide informative insights Read more…to our readers. Our journal analysts bring years of experience in market analysis and blockchain technology to ensure factual accuracy and balanced reporting. By following our Editorial Policy, our writers verify every source, fact-check each story, rely on reputable sources, and attribute quotes and media correctly. We also follow a rigorous Review Methodology when evaluating exchanges and tools. From emerging blockchain projects and coin launches to industry events and technical developments, we cover all facets of the digital asset space with unwavering commitment to timely, relevant information.

Related Articles


- Bitcoin vs Gold Feb 2026: Which Asset Could Spike Next?
- Top 3 Reasons Why Crypto Market is Down Today (Feb. 22)
- Michael Saylor Hints at Another Strategy BTC Buy as Bitcoin Drops Below $68K
- Expert Says Bitcoin Now in ‘Stage 4’ Bear Market Phase, Warns BTC May Hit 35K to 45K Zone
- Bitcoin Price Today As Bulls Defend $65K–$66K Zone Amid Geopolitics and Tariffs Tensions
- COIN Stock Price Prediction: Will Coinbase Crash or Rally in Feb 2026?
- Shiba Inu Price Feb 2026: Will SHIB Rise Soon?
- Pi Network Price Prediction: How High Can Pi Coin Go?
- Dogecoin Price Prediction Feb 2026: Will DOGE Break $0.20 This month?
- XRP Price Prediction As SBI Introduces Tokenized Bonds With Crypto Rewards
- Ethereum Price Rises After SCOTUS Ruling: Here’s Why a Drop to $1,500 is Possible


