 Buy $GGs
Cardano Price Prediction Hints a Make or Break Scenario; What Ahead for $ADA?


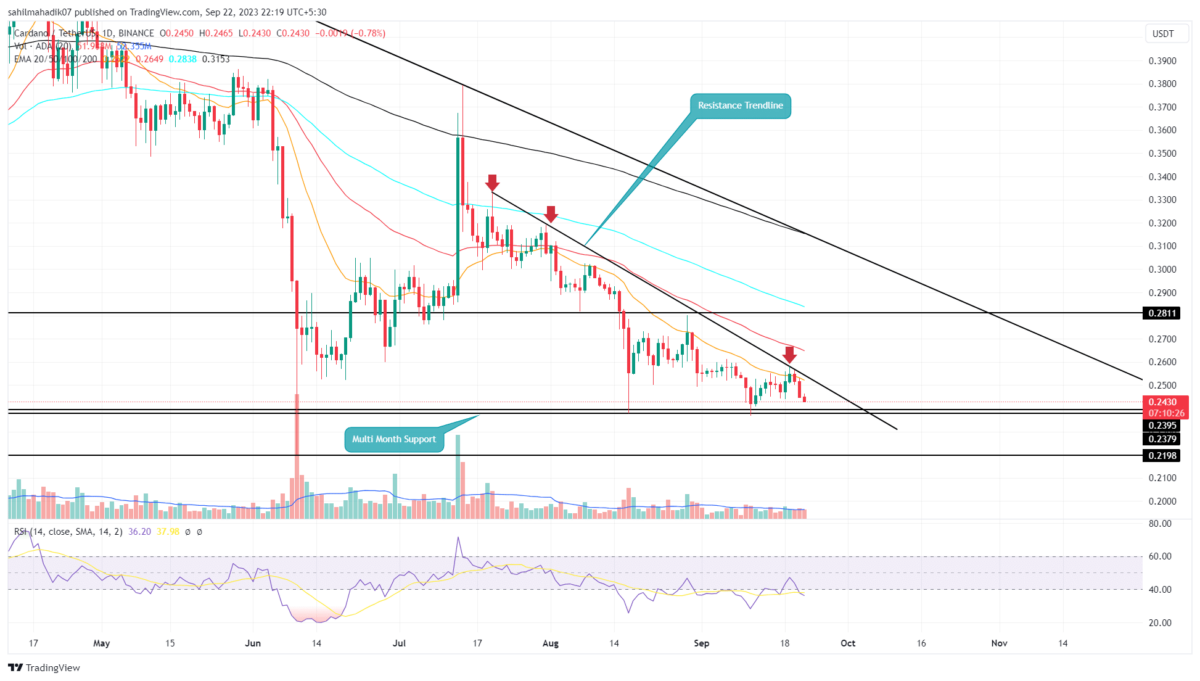
In sync with the movements of the crypto giants, Bitcoin and Ethereum, the Cardano coin price began experiencing selling pressure starting September 28th. This led to its price being pulled down from resistance at $0.2576, shaping a V-top reversal pattern. This recent decline has marked the third time ADA has been turned away from a persistent resistance trendline, reinforcing the ongoing bearish narrative.
Also Read: Cardano Project Catalyst Wraps Up Fund 10, Here are Key Takeaways
Will the ADA Price Fall to $0.22?
- A bullish breakout from the resistance trendline is needed to trigger a sustained recovery
- A breakdown below the $0.24 support will plunge the ADA price by 8%
- The intraday trading volume in the ADA coin is $114 Million, indicating an 8.8% loss.
 Source- Tradingview
The current sell-off around the $0.255 level has led ADA to shed 5% over the past two days. Currently, this eighth-largest cryptocurrency value stands at $0.244. If sellers continue to exert pressure, we might see a decline further by approximately 3%, targeting the immediate support level at $0.244.
A daily close beneath this price could see ADA price sliding towards the next support at $0.22, with the potential to go even lower to the $0.2 psychological level.
Conversely, if the $0.24 support— which has stood steadfast for over a year— remains unbreached, we may see ADA trading in a narrow range between the declining trendline and its longstanding horizontal support.
A break above the descending trendline would be a more bullish signal, hinting at a possible change in the current trend.
ADA vs ETH vs BTC Performance
 Source: Coingape| Cardano Vs Ethereum Vs Bitcoin Price
When looking at the bigger picture over the past three months, Cardano seems to have faced more price fluctuations than both BTC and ETH. Since mid-August, the ADA price trajectory has been distinctly bearish, consistently forming lower lows, signaling a deep-rooted downtrend.
Meanwhile, both Bitcoin price and Ethereum price have been trading more horizontally, indicating a short-term period of consolidation or sideways movement.
Play 10,000+ Casino Games at BC Game with Ease
- Instant Deposits And Withdrawals
- Crypto Casino And Sports Betting
- Exclusive Bonuses And Rewards


Why Trust CoinGape
CoinGape has covered the cryptocurrency industry since 2017, aiming to provide informative insights Read more…to our readers. Our journal analysts bring years of experience in market analysis and blockchain technology to ensure factual accuracy and balanced reporting. By following our Editorial Policy, our writers verify every source, fact-check each story, rely on reputable sources, and attribute quotes and media correctly. We also follow a rigorous Review Methodology when evaluating exchanges and tools. From emerging blockchain projects and coin launches to industry events and technical developments, we cover all facets of the digital asset space with unwavering commitment to timely, relevant information.

Related Articles


- BTC Price Bounces as Spot Investors Buy The Dip Amid Iran War Jitters
- CFTC Chief Mike Selig Signals US Crypto Perpetual Futures Rollout in Coming Weeks
- Fed Rate Cut Odds Drop as Inflation Fears Rise Due To U.S. Iran Conflict
- Here’s Why Tether Gold (XAUt) Price Is Falling Even With Growing Gold Demand
- XRP News: Ripple Expands Payments Platform To Unify Fiat and Stablecoins Globally
- Gold Price Prediction March 2026: Rally, Crash, or Record Highs?
- RIOT Stock Prediction as Needham, Piper Sandler Slash Target After Earnings
- Cardano Price Outlook As Charles Hoskinson Warns Over CLARITY Act
- Circle Stock Price Climbs 15% to $96, Can Rally Continue in March 2026?
- Bitcoin Price Prediction as US-Iran War Enters 4th Consecutive Day
- Top 5 Historical Reasons Dogecoin Price Is Not Rising


