Cardano Price Prediction: Will $ADA Price Lose $0.3 Support In June


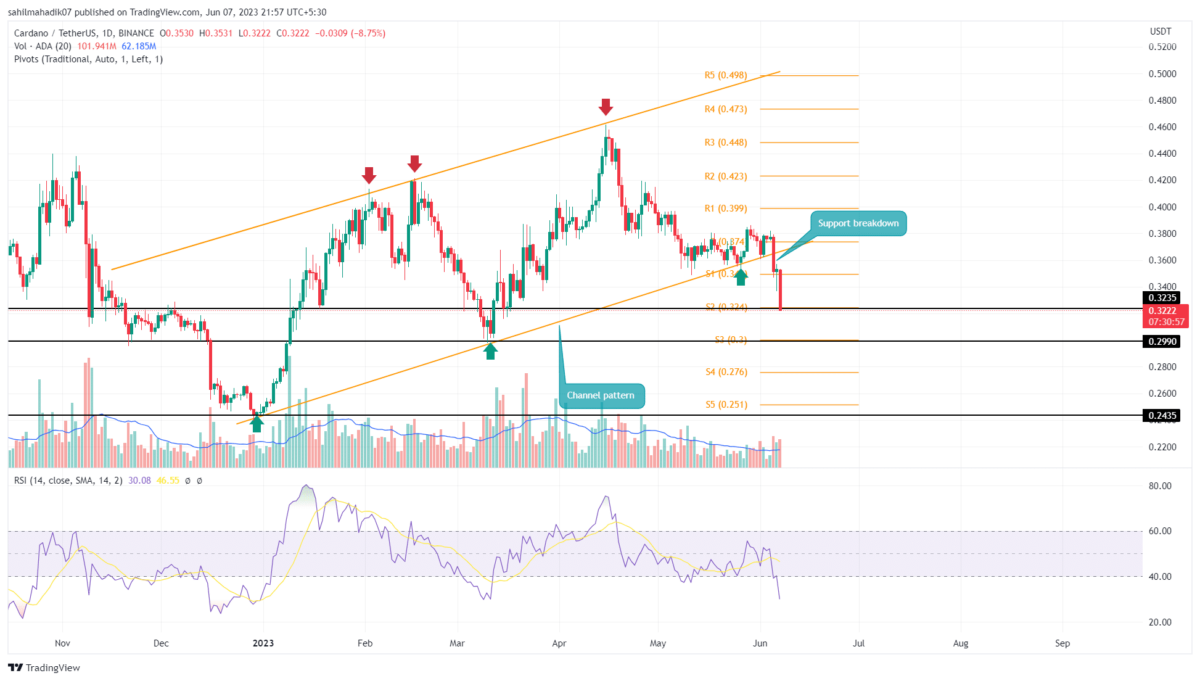
Cardano Price Prediction: On June 5th, the ADA price showcased a massive breakdown from the support trendline of the channel pattern carrying an uptrend in this coin for the past five months. This breakdown accelerates the selling pressure in the market and provides sellers a new resistance to pressurize prices to lower levels. Here’s how this pattern could further induce the Cardano coin.
Also Read: Cardano Foundation Disagrees With US SEC; Robinhood May Delist $ADA
- A breakdown below the local support of $0.323 support set ADA price for a 7.5% drop
- The downsloping daily EMAs(20, 50, 100, and 200) indicate the buyers would face multiple hurdles before regaining trend control
- The intraday trading volume in the ADA coin is $336.5 Million, indicating a 19.6% gain.
 Source- Tradingview
A bearish breakdown from the support trendline indicates the ADA price is likely to prolong its prior downtrend. From the breakdown point, the price has plunged 9.5% so far and is currently trading at the $0.329 mark.
With sustained selling, the coin price is likely to plunge another 9.6% down to hit the $0.3 psychological mark. The aforementioned level should hold buyers’ orders from numerous traders waiting to enter at a discounted price.
However, in theory, the potential target for this pattern breakdown is the swing lows created during the formation of channel patterns. Thus, considering a pessimistic scenario, a successful breakdown below the $0.3 support would plummet the price to $0.245.
Will Cardano Coin Loss the $0.3 Mark?
An intraday loss of 7.7% with high volume indicates high momentum selling in ADA price. If selling pressure persists, this ADA price will break minor support of $0.323 and slump to the $0.3 level. This psychological support won’t be easily broken and therefore, the price will likely consolidate above it for a few days before any further downfall
- Relative Strength Index: The daily RSI slope plunged to the oversold region indicating the sellers went too aggressive for the time being, and therefore a minor pullback or consolidation is expected to stabilize the price action.
- Pivot levels: This Support/Resistance indicator accentuates the $0.323 and $0.3 levels as important support while it indicates the $0.35 and $0.374.

Why Trust CoinGape
CoinGape has covered the cryptocurrency industry since 2017, aiming to provide informative insights Read more…to our readers. Our journal analysts bring years of experience in market analysis and blockchain technology to ensure factual accuracy and balanced reporting. By following our Editorial Policy, our writers verify every source, fact-check each story, rely on reputable sources, and attribute quotes and media correctly. We also follow a rigorous Review Methodology when evaluating exchanges and tools. From emerging blockchain projects and coin launches to industry events and technical developments, we cover all facets of the digital asset space with unwavering commitment to timely, relevant information.
Related Articles


- How “Quiet Builders” Are Winning the Web3 Race
- XRP News: Ripple Taps Zand Bank to Boost RLUSD Stablecoin Use in UAE
- BitMine Keeps Buying Ethereum With New $84M Purchase Despite $8B Paper Losses
- Polymarket Sues Massachusetts Amid Prediction Market Crackdown
- CLARITY Act: Bessent Slams Coinbase CEO, Calls for Compromise in White House Meeting Today
- Ethereum Price Outlook As Vitalik Dumps ETH While Wall Street Accumulates
- XRP Price Prediction Ahead of White House Meeting That Could Fuel Clarity Act Hopes
- Cardano Price Prediction as Bitcoin Stuggles Around $70k
- Bitcoin Price at Risk of Falling to $60k as Goldman Sachs Issues Major Warning on US Stocks
- Pi Network Price Outlook Ahead of This Week’s 82M Token Unlock: What’s Next for Pi?
- Bitcoin and XRP Price Prediction as China Calls on Banks to Sell US Treasuries


