Cardano Price to Lose $0.3 Support? Overhead Supply Points to Upcoming Correction


The recent correction phase in the Cardano price found suitable support at the $0.3 mark. Over the past two weeks, the coin price hovering above the aforementioned support trying to replenish exhausted bullish momentum. However, despite several attempts from crypto buyers, the altcoin is wavering flat indicating a weakness in bullish momentum. Will the sellers take this to their advantage and break the $0.3 mark?
Also Read: Cardano Founder Discusses Latest ADA Developments, XRP Lawsuit, And Crypto Regulations
Cardano Price Daily Chart
- The ADA price may prolong a bullish rally until the lower support trendline is intact.
- A breakdown from the $0.3 support will set a sharp 8.5% dip in ADA price
- The intraday trading volume in the ADA coin is $138.6 Million, indicating a 13% loss.
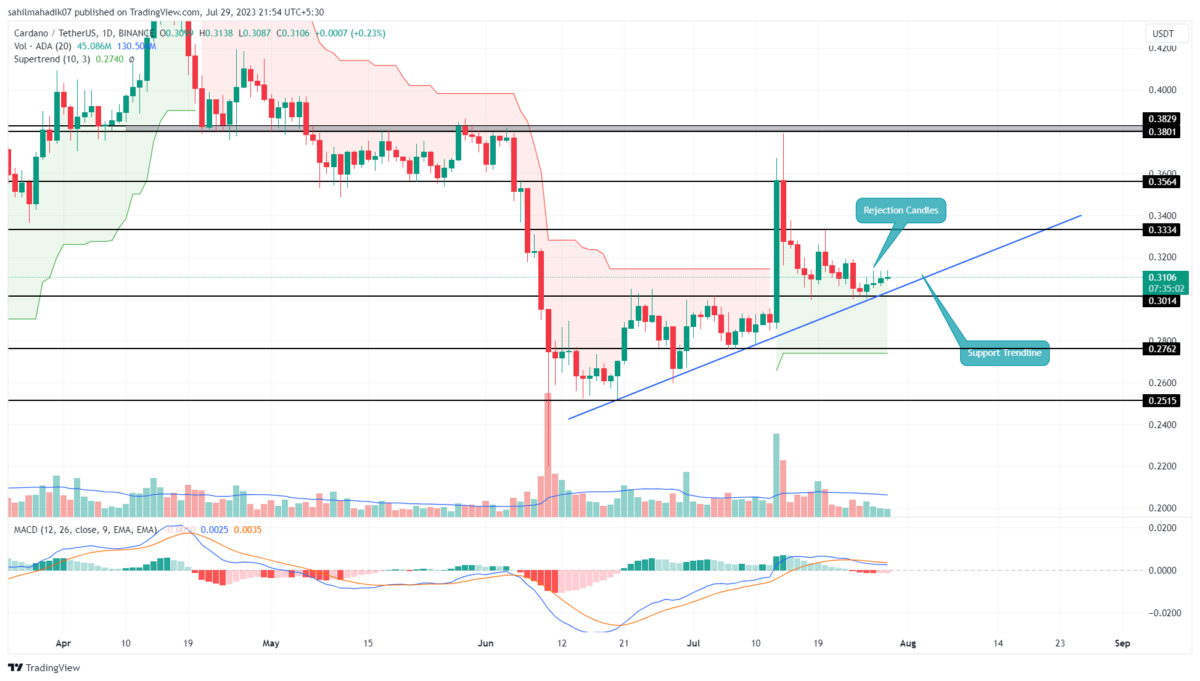
 Source- Tradingview
On July 26th, the Cardano price rebounded from the confluence support of $0.3 and a rising trendline with a morning star candle. The daily chart shows the ascending trendline has been offering dynamic support to market buyers for nearly six weeks.
Despite this strong push, the ADA price has surged 3% in the last four days and reached the current price of $0.3107. Moreover, the higher price rejection attached to green daily candles and reducing volume indicates overhead supply and weakness in bullish momentum.
If the coin sellers receive some boost from the weakening market sentiment, the altcoin price would showcase a decisive breakdown below $0.3 and the support trendline.
This possible breakdown would invalidate the recovery sentiment and set the 8th largest cryptocurrency for a significant drop. The post-breakdown fall would clutch the Cardano price to $0.27, followed by $0.25 support.
[converter id=”ada-cardano” url=”https://coingape.com/price/converter/cardano-to-usd/?amount=1″]
Can ADA Price Prolong Recovery Rally?
While things look bearish for the Cardano coin, the crypto holders can maintain a bullish outlook until the rising trendline is intact. if the support trendline holds and the prices give an upside breakout from the $0.33 immediate resistance, the buyers would get some edge to resume a bullish rally and reach the $0.38 high.
- Super trend indicator: The green film projected in the daily chart reflects the market trend is currently bullish.
- Moving Average Convergence/Divergence: the flattish MACD(blue) and signal(orange) slope indicate a neutral sentiment among the participants.

Why Trust CoinGape
CoinGape has covered the cryptocurrency industry since 2017, aiming to provide informative insights Read more…to our readers. Our journal analysts bring years of experience in market analysis and blockchain technology to ensure factual accuracy and balanced reporting. By following our Editorial Policy, our writers verify every source, fact-check each story, rely on reputable sources, and attribute quotes and media correctly. We also follow a rigorous Review Methodology when evaluating exchanges and tools. From emerging blockchain projects and coin launches to industry events and technical developments, we cover all facets of the digital asset space with unwavering commitment to timely, relevant information.

Related Articles


- CLARITY Act: Trump’s Crypto Adviser Says Stablecoin Yield Deal Is “Close” as March 1 Deadline Looms
- Trump Tariffs: U.S. To Impose 10% Global Tariff Following Supreme Court Ruling
- CryptoQuant Flags $54K Bitcoin Risk As Trump Considers Limited Strike On Iran
- Why Is Bitdeer Stock Price Dropping Today?
- Breaking: U.S. Supreme Court Strikes Down Trump Tariffs, BTC Price Rises
- Ethereum Price Rises After SCOTUS Ruling: Here’s Why a Drop to $1,500 is Possible
- Will Pi Network Price See a Surge After the Mainnet Launch Anniversary?
- Bitcoin and XRP Price Prediction As White House Sets March 1st Deadline to Advance Clarity Act
- Top 3 Price Predictions Feb 2026 for Solana, Bitcoin, Pi Network as Odds of Trump Attacking Iran Rise
- Cardano Price Prediction Feb 2026 as Coinbase Accepts ADA as Loan Collateral
- Ripple Prediction: Will Arizona XRP Reserve Boost Price?


