 Buy $GGs
Chainlink Price Prediction: What’s Next for $LINK After Regaining $10 Mark?


Chainlink Price Prediction: The Chainlink coin has emerged as a standout performer in the ongoing crypto market recovery. From the low of $7.26 on October 20, the coin price has soared by 51%, touching a current trading value of $11.02. This impressive ascent marks the coin’s escape from a 16-month accumulation phase, signaling the potential for an even more substantial rally ahead.
Also Read: Chainlink’s Upcoming Staking v0.2 Launch Boosts Market Optimism
Overhead Supply Hints Upcoming Pullback
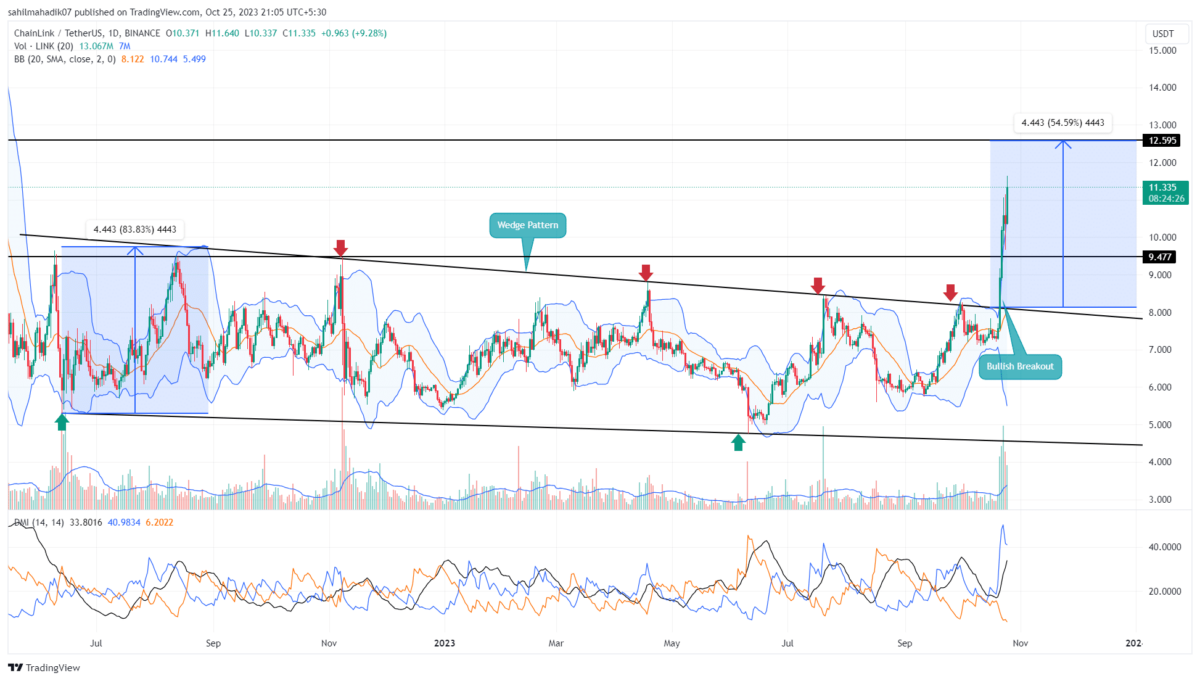
- A wick rejection attached to the daily candle reflects a minor retracement ahead
- Under the influence of the wedge pattern, the LINK price is poised for a further 14%
- The intraday trading volume in the LINK coin is $1.2 Billion, indicating a 1.2% gain.
 Source- Tradingview
On October 21, the Chainlink price broke free from a longstanding falling wedge pattern—a trend that had been dictating its price action for more than 500 days. This breakout is a significant milestone and offers a bullish forecast for this altcoin’s future price trajectory. Bolstered by sustained buying interest and improving market sentiment, the coin surged to an intraday high of $11.5.
However, the daily chart over the past three days shows a pattern of higher price rejections near the $11 mark. These long wicks suggest that short-term traders may be taking profits off the table. Should the selling pressure continue, the LINK price may experience a minor pullback before making its next significant move upward.
According to Fibonacci retracement levels, the coin could find strong support at around the $10.2 mark, coinciding with the 23.6% retracement level. Additional support could be seen at the $9.5 level, aligned with the 38.2% Fibonacci retracement.
Taking cues from the completed wedge pattern, the LINK is poised for a rally toward $12.5, which would represent a potential gain of approximately 14%.
LINK vs BTC Performance
 Source: Coingape| Chainlink Vs Bitcoin Price
In a comparative analysis, the Bitcoin price has been on a slow yet consistent path to recovery since November 2022. Meanwhile, the chainlink coin experienced only a mild correction during the same period. However, both assets have benefited from the recent uptick in buying pressure, with the LINK price projecting a steeper rally pointing towards aggressive bullish momentum in the asset.
- Bollinger Band: the upswing in the upper boundary of the Bollinger Band indicator reflects the market’s bullish momentum is still active.
- Moving Average Convergence Divergence: The large gap between the MACD(blue) and signal(orange) slope in positive alignment reflects the current market trend is bullish.
Play 10,000+ Casino Games at BC Game with Ease
- Instant Deposits And Withdrawals
- Crypto Casino And Sports Betting
- Exclusive Bonuses And Rewards


Why Trust CoinGape
CoinGape has covered the cryptocurrency industry since 2017, aiming to provide informative insights Read more…to our readers. Our journal analysts bring years of experience in market analysis and blockchain technology to ensure factual accuracy and balanced reporting. By following our Editorial Policy, our writers verify every source, fact-check each story, rely on reputable sources, and attribute quotes and media correctly. We also follow a rigorous Review Methodology when evaluating exchanges and tools. From emerging blockchain projects and coin launches to industry events and technical developments, we cover all facets of the digital asset space with unwavering commitment to timely, relevant information.

Related Articles


- Best Institutional Custody Solutions for Tokenized Assets in 2026
- Minnesota Considers Ban on Bitcoin and Crypto ATMs as Scam Reports Rise
- Breaking: Morgan Stanley Applies For Crypto-Focused National Trust Bank With OCC
- Ripple Could Gain Access to U.S. Banking System as OCC Expands Trust Bank Services
- $2T Barclays Explores Blockchain For Stablecoin Payments and Tokenized Deposits
- Top Analyst Predicts Pi Network Price Bottom, Flags Key Catalysts
- Will Ethereum Price Hold $1,900 Level After Five Weeks of $563M ETF Selling?
- Top 2 Price Predictions Ethereum and Solana Ahead of March 1 Clarity Act Stablecoin Deadline
- Pi Network Price Prediction Ahead of Protocol Upgrades Deadline on March 1
- XRP Price Outlook As Jane Street Lawsuit Sparks Shift in Morning Sell-Off Trend
- Dogecoin, Cardano, and Chainlink Price Prediction As Crypto Market Rebounds


