Chart Pattern Hints SOL Price Correction to Hit $16; Sell or Hold?


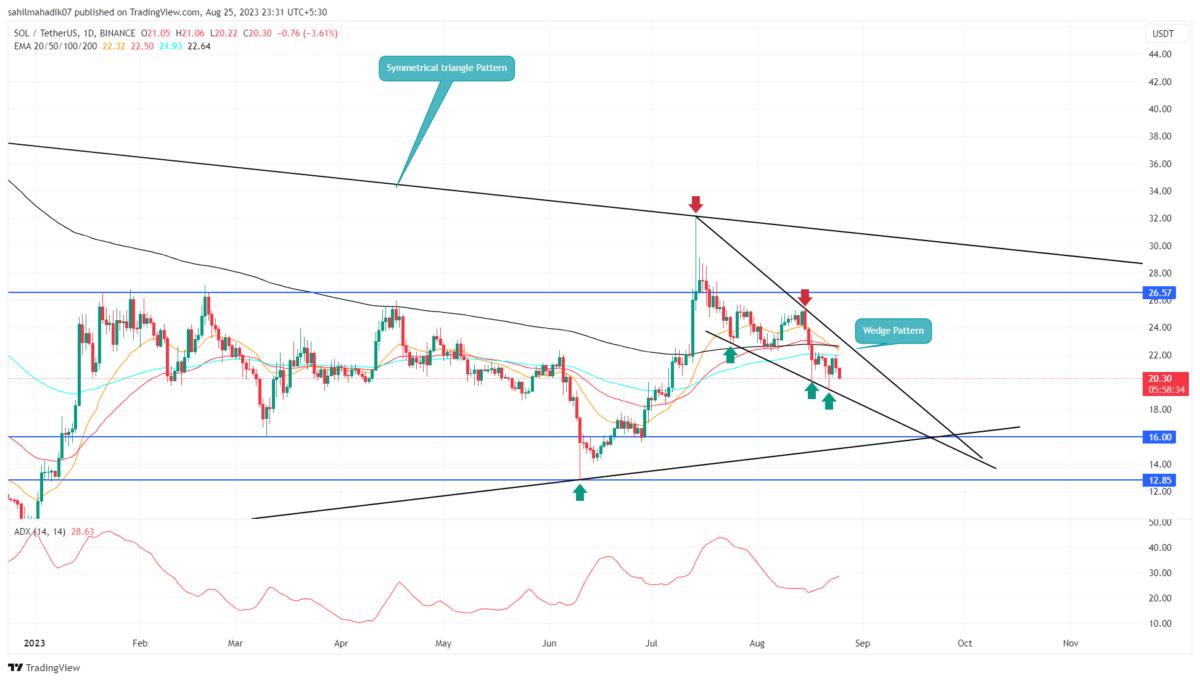
Over the last six weeks, the Solana coin has undergone a notable correction phase. Commencing from its peak at $32.13, the cryptocurrency’s value has declined 36.8%, leading to its present trading price of $21.39. This retracement has fallen below the 50% level of the June-July recovery level hinting bearish momentum is aggressive which could lead to further downfall. However, the falling price has shaped into a falling wedge pattern which could significantly influence the future trend.
Also Read: Shopify Enables Solana (SOL) Pay
Solana Daily Chart: Key Points
- The Solana price rebounded several times from a wedge pattern reflecting its strong influence on market participants.
- A death crossover between the 50-and-200-day EMA may intensify the selling momentum
- The 24-hour trading volume on the Solana coin is $280.9 Million, indicating a 24.3% gain.
 Source-Tradingview
A falling wedge pattern is characterized by converging trendlines that slope in a downward direction, forming a wedge-like shape. The chart pattern signifies a potential shift in market sentiment from bearish to bullish, as the price range between the two converging trendlines gradually narrows over time.
By the press time, the SOL Price trades at $20.37, with an intraday loss of 3.28%. The falling price soon retests the lower trendline which puts demand pressure for a bullish upswing. A potential recovery with this pattern will lead the prices to the overhead trendline or near the $21.55 mark
However, until these two trendlines are intact this ninth-largest cryptocurrency may prolong the downward trendline potential falling to the $16 mark.
Will SOL Price Recover to $30?
Though the nature of the wedge structure showcases a downward leading set up, the common outcome of the pattern is a bullish reversal after the price breaks the above trendline. Therefore, the inverted market participants can wait for an overhead resistance breakout which leads to a recovery rally to $25.5 or $30.
- Exponential Moving Average: The coin price trading below daily EMAs(20, 50, 100, and 200) indicate the path to least resistance is downward
- Average Directional Index: An uptick in the daily ADX slope near the 28% mark reflects the sellers’ having enough strength to lead a longer downtrend.

Why Trust CoinGape
CoinGape has covered the cryptocurrency industry since 2017, aiming to provide informative insights Read more…to our readers. Our journal analysts bring years of experience in market analysis and blockchain technology to ensure factual accuracy and balanced reporting. By following our Editorial Policy, our writers verify every source, fact-check each story, rely on reputable sources, and attribute quotes and media correctly. We also follow a rigorous Review Methodology when evaluating exchanges and tools. From emerging blockchain projects and coin launches to industry events and technical developments, we cover all facets of the digital asset space with unwavering commitment to timely, relevant information.

Related Articles


- Fed’s Chris Waller Says Support For March Rate Cut Will Depend On Jobs Report
- Breaking: Tom Lee’s BitMine Adds 51,162 ETH Amid Vitalik Buterin’s Ethereum Sales
- Breaking: Michael Saylor’s Strategy Makes 100th Bitcoin Purchase, Buys 592 BTC as Market Struggles
- Satoshi-Era Whale Dumps $750M BTC as Hedge Funds Pull Out Billions in Bitcoin
- XRP Sees Largest Realized Loss Since 2022, History Points to Bullish Price Run: Report
- Top 3 Meme Coins Price Prediction As BTC Crashes Below $67k
- Top 4 Reasons Why Bitcoin Price Will Crash to $60k This Week
- COIN Stock Price Prediction: Will Coinbase Crash or Rally in Feb 2026?
- Shiba Inu Price Feb 2026: Will SHIB Rise Soon?
- Pi Network Price Prediction: How High Can Pi Coin Go?
- Dogecoin Price Prediction Feb 2026: Will DOGE Break $0.20 This month?


