 Buy $GGs
Cosmos Price Analysis: This Bullish Formation Hints At More Gains; Time To Buy?


The Cosmos price analysis indicates consolidation with a positive bias. The price traded in a very range-bound manner with a mildly positive outlook. However, investors need additional confirmation to trade firmly in a particular direction.
Despite the challenges, Cosmos managed to grab the 23rd rank in terms of the market capitalization of $3,498,682,326. As of writing, ATOM/USD is exchanging hands at $12.22, up 0.87% for the day. The 24-hour trading volume rose 10% to $5.03billion.
- Cosmos price trade a bit higher with limited price action.
- A double-top structure indicates some challenges for the bulls.
- However, rising volume favors the upside in the coin.
Cosmos price stabilizes
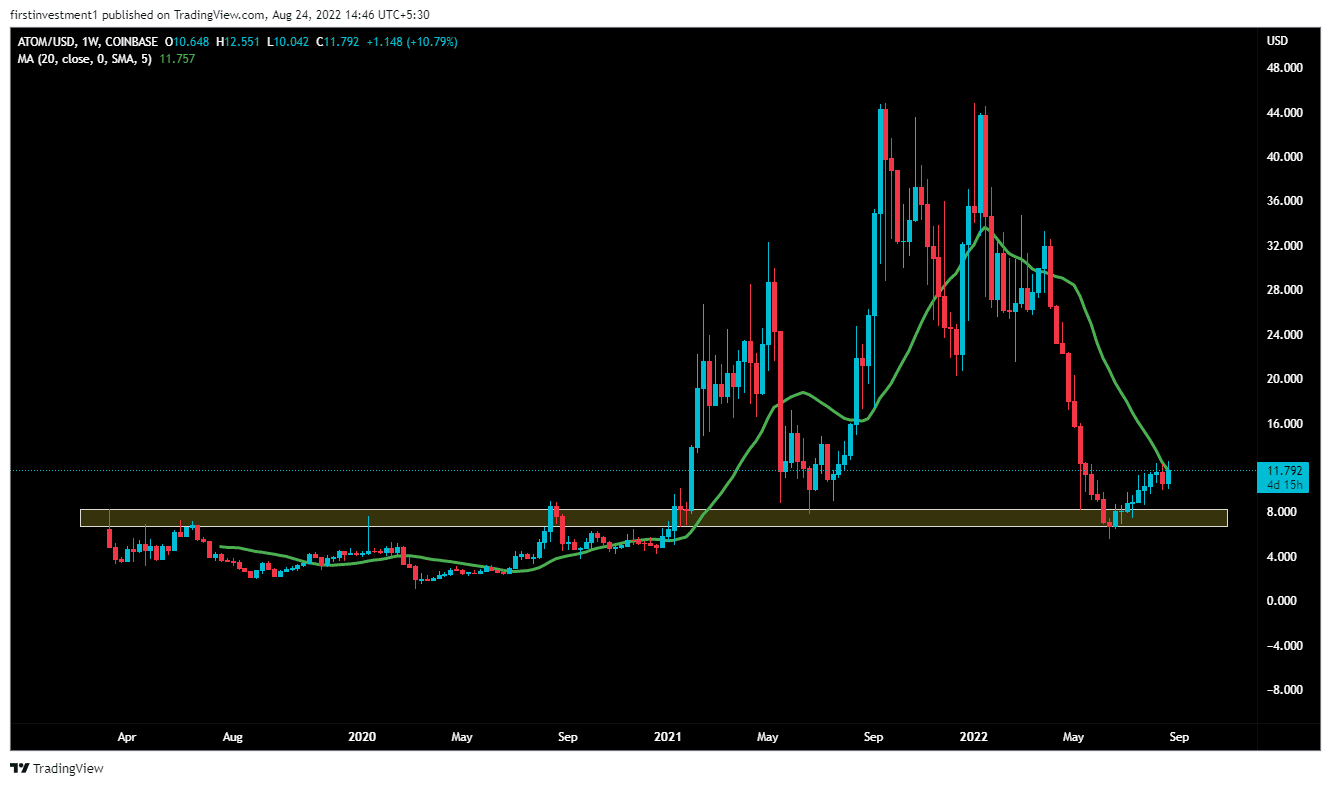
On the weekly chart, ATOM took reliable support good near $8.1, which was previously acted as resistance from March 11, 2019, to February 02, 2021.
However, On February 03, the price gave a breakout above $8.1, with an upside of more than 450% after the breakout. Recently, the price came for a retest at exactly $8.1 level, & started to move back up again, implying a possible reversal and “Buy on dips” strategy.
Further, the price faces resistance at the 20-day exponential moving average ( $12.32). If the price is able to break above this given level on the weekly chart, then we can expect a good upside move of up to $14.50.
Remember, if the price couldn’t sustain close to current levels in the coming days, and started to fall, then it amplifies bearishness in the short time.
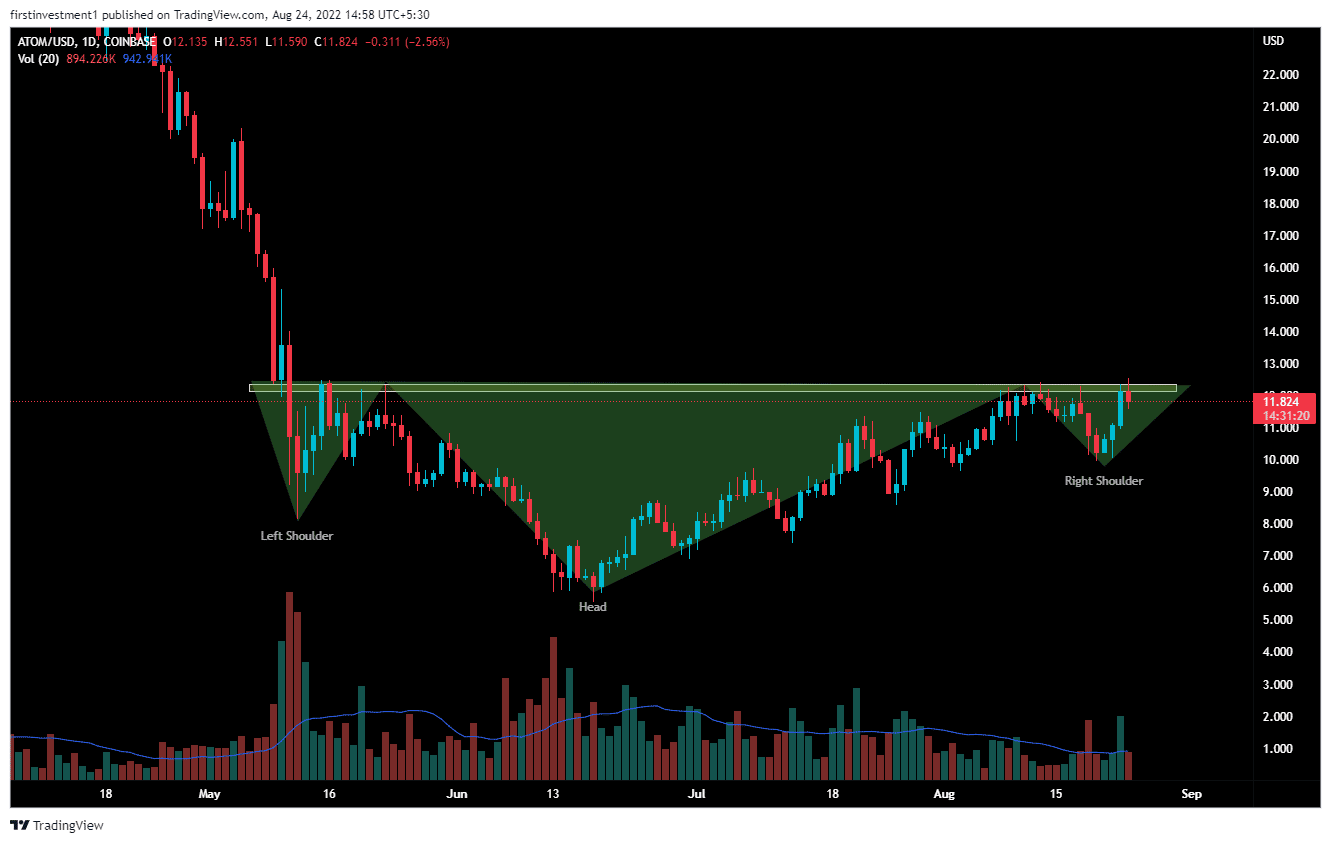
On the daily time frame, the price formed a bullish “Head & Shoulder” pattern. The asset is currently trading at the pattern neckline, facing the resistance of ($12.60).
According to this pattern, if the price breaks the above neckline on the higher side and gave closing above this line, then we can enter a buying trade, with an upside of up to ($15.55). The more time spent during the consolidation near resistance before the breakout, the price would move with higher force toward the higher level.
Also read: Just-In: These Records Largest Crypto Exchange Traffic Since Market Crash
The nearest support is ($10.30) whereas the most immediate resistance is around ($13.00). There is a higher probability of the price breaking its resistance on higher levels.
In addition, if the price is corrected toward the support level then it would be a good “Buy on dips” Opportunity.
On the other hand, a break below the $10.30 level could invalidate the bullish outlook. And the price can move below $8.6.
ATOM is slightly bullish on all time frames. Above $12.60 closing on the hourly time frame, we can put a trade on the buy side.
Play 10,000+ Casino Games at BC Game with Ease
- Instant Deposits And Withdrawals
- Crypto Casino And Sports Betting
- Exclusive Bonuses And Rewards


Why Trust CoinGape
CoinGape has covered the cryptocurrency industry since 2017, aiming to provide informative insights Read more…to our readers. Our journal analysts bring years of experience in market analysis and blockchain technology to ensure factual accuracy and balanced reporting. By following our Editorial Policy, our writers verify every source, fact-check each story, rely on reputable sources, and attribute quotes and media correctly. We also follow a rigorous Review Methodology when evaluating exchanges and tools. From emerging blockchain projects and coin launches to industry events and technical developments, we cover all facets of the digital asset space with unwavering commitment to timely, relevant information.

Related Articles


- “There Is Only One Gold,” Billionaire Ray Dalio Says Amid BTC’s Quantum Threats
- Goldman Sachs CEO Predicts ‘Weeks’ of Crypto Market Crash as U.S Iran War Continues
- Polymarket Axes ‘Nuclear Detonation’ Prediction Market Amid Public Fury
- Indiana Signs Bitcoin Bill Into Law Allowing Crypto in Retirement Plans
- ‘Time to Act Is Now’: CFTC Chief Pushes Swift Passage of CLARITY Act
- Bitcoin Price At Risk? Professor Who Predicted US-Iran War Says America Could Lose
- Gold Price Prediction March 2026: Rally, Crash, or Record Highs?
- RIOT Stock Prediction as Needham, Piper Sandler Slash Target After Earnings
- Cardano Price Outlook As Charles Hoskinson Warns Over CLARITY Act
- Circle Stock Price Climbs 15% to $96, Can Rally Continue in March 2026?
- Bitcoin Price Prediction as US-Iran War Enters 4th Consecutive Day


