
CRV Price Analysis: Buyers Prepare To Boost CRV Prices To $1


The long-term downtrend in Curve Dao (CRV) price reversed from $0.54 to challenge the opposition of the 20-day EMA. The support of technical indicators and the trading volume increases the likelihood of a breakout rally surpassing the daily EMAs. Should you consider going bullish in hopes of a breakout rally?
Key points:
- The DMI indicator prepares a crossover reflecting a bullish trend reversal.
- The CRV price will need to surpass the 20-day EMA to continue the bullish growth.
- The intraday trading volume in the CRV token is $408 Million, indicating a 10% gain.
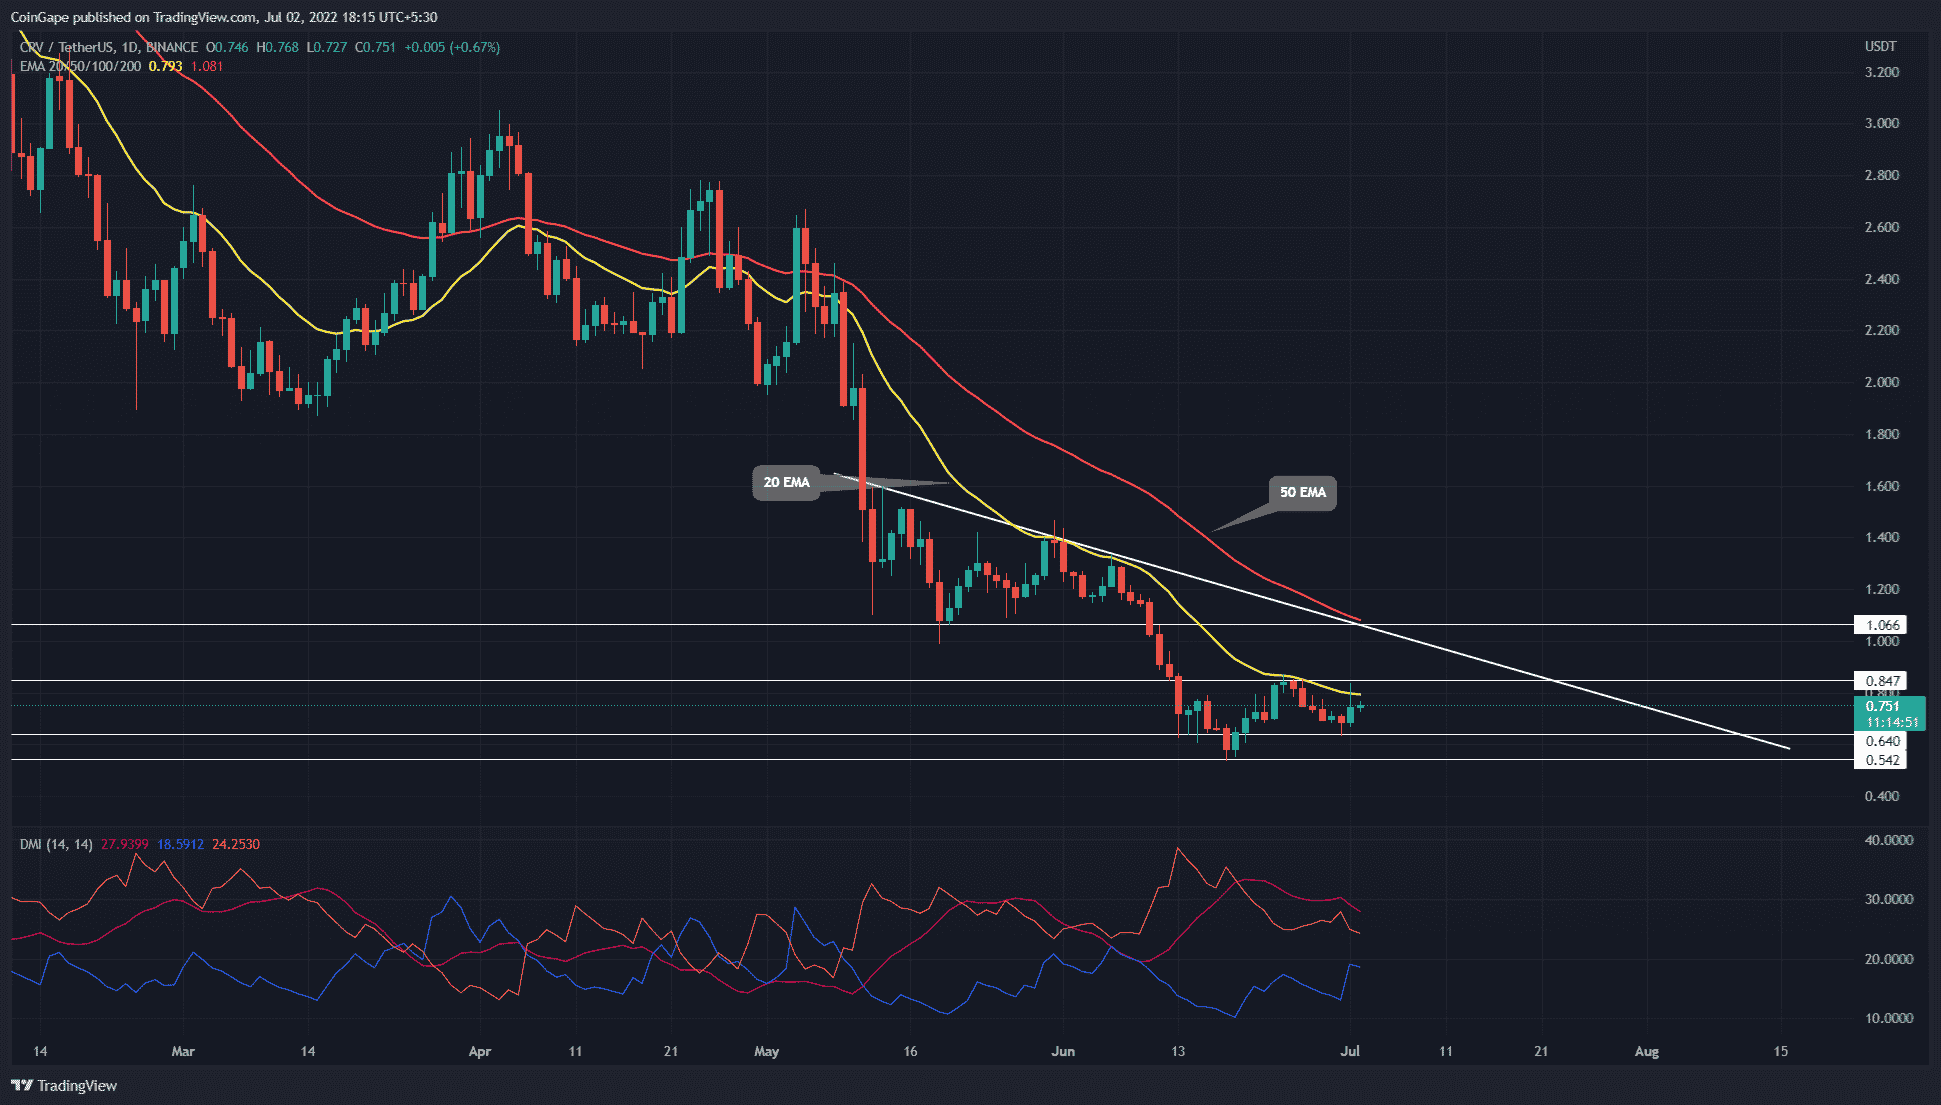
Source-Tradingview
Amid the falling global markets, the altcoin prices continue to plunge with excessive selling pressure. Curve Dao (CRV) prices display a similar trend under the influence of the 20-day EMA providing dynamic resistance.
The bearish trend accounts for an 80% drop in CRV market price from $2.6 to the bottom support at $0.54 within the two months. However, the buyers attempt to reclaim the trend momentum and challenge the 20-day EMA.
The declining price trend generates a bearish resistance trendline in the daily technical chart. The recent bullish attempt from the $0.64 mark goes against the 20-day EMA and the resistance level of $0.85.
Currently going against a confluence of bearish elements, the CRV prices can skyrocket to the next important psychological mark of $1.
The breakout rally will also test the 50-day EMA at the psychological mark, the breakout of which will increase the likelihood of a prolonged uptrend to $1.40. But, more importantly, the EMA breakout will also account for the resistance trendline breakout, unloading the traped momentum.
Conversely, suppose the CRV buyers fail to undermine the excessive selling pressure from the 20-day EMA, a downfall to $0.54 will be inevitable.
Thus, a bullish breakout from longer resistance could trigger a genuine recovery.
Technical analysis
The dynamic resistance of the 20-day EMA is a highly important bearish element, keeping the bullish growth in check since early 2022. Hence, traders can find the EMA breakout triggering a sharp price jump.
The DI lines showcase a growing bullish influence as the lines display a declining bearish spread in an attempt to reclaim bullish alignment. Hence, the DMI indicator may shortly show a crossover indicating a trend reversal and increasing the breakout chances.
- Resistance levels- $0.85 and $1
- Support levels- $0.64 and $0.54
Play 10,000+ Casino Games at BC Game with Ease
- Instant Deposits And Withdrawals
- Crypto Casino And Sports Betting
- Exclusive Bonuses And Rewards


Why Trust CoinGape
CoinGape has covered the cryptocurrency industry since 2017, aiming to provide informative insights Read more…to our readers. Our journal analysts bring years of experience in market analysis and blockchain technology to ensure factual accuracy and balanced reporting. By following our Editorial Policy, our writers verify every source, fact-check each story, rely on reputable sources, and attribute quotes and media correctly. We also follow a rigorous Review Methodology when evaluating exchanges and tools. From emerging blockchain projects and coin launches to industry events and technical developments, we cover all facets of the digital asset space with unwavering commitment to timely, relevant information.


- Michael Saylor Hints at Another Strategy Bitcoin Buy With ‘Stretch the Orange Dots’ Post
- Will CLARITY Act Pass in 2026? Galaxy’s Alex Thorn Warns April Deadline Is Critical
- Tom Lee’s Bitmine Adds 5,000 ETH Despite $7.5B Unrealized Loss as BMNR Stock Rebounds
- CLARITY Act Should Ban Stablecoin Yields to Advance in Senate, French Hill Says
- U.S. Set to Deploy Warships to Keep the Strait of Hormuz Open, Bitcoin Climbs
- Solana vs XRP Price Forecast: Can SOL Reclaim Its All-Time High Before XRP Hits $2?
- Top Analyst Predicts Cardano Price Could Surge 100% As Bitcoin Breaks $72k
- What’s Keeping Shiba Inu Below $0.0000065- Analyst Predicts 30% Rise Ahead
- BTC Price to $100K by 2026? Kalshi and Polymarket Odds Climb to 42%
- Why Pi Network Price Surged 30% Today?
- What Happens to XRP Price If US Wins War Against Iran?


