Curve Dao Price Analysis: Will $CRV Price Clear $1 Barrier this August?


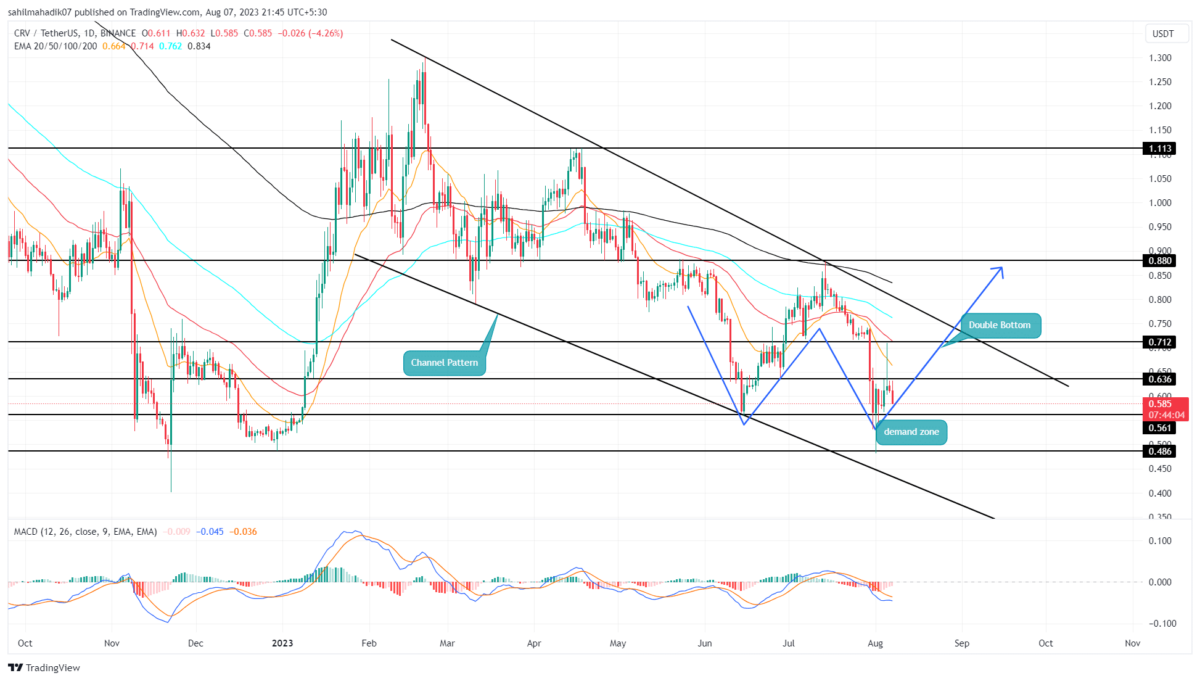
Curve Dao Price Analysis: Over the past months, the Curve Dao price has followed a steady downtrend under the influence of a falling channel pattern. With the two trendlines, altcoin has reverted twice from dynamic resistance and support, indicating its strong influence on CRV price. On July 14th, the prices witnessed their latest reversal from the overhead trendline, which triggered 44.7% and evaporated the June Mid recovery. Is this pullback safe to enter?
Also Read: Curve DAO (CRV) Up 8%, Is This its Second Chance?
Curve Dao Price Analysis
- Double bottom patterns set the CRV price for 20 upswings
- The coin price below 200-day EMA reflects the overall market trend is bearish.
- The intraday trading volume in the CRV token is $48.5 Million, indicating a 26% loss.
 Source- Tradingview
After the recent downturn, the Curve Dao price found suitable support near the $0.56 mark. The lower price rejection was observed on August 1st, indicating the accumulation of buyers is discounted price.
In the daily chart, the CRV price witnessed this second reversal from the horizontal support indicating the formation of a double bottom pattern. So far the bullish reversal has surged 8% to reach the current price of $0.614.
Under the influence of the double bottom pattern, the buyers should drive the prices 20% higher to challenge the upper trendline of the channel pattern. A bullish breakout from this resistance will be a better confirmation of trend reversal.
The post-breakout rally could reach the first target of around $0.08, followed $1.1
Is this the Right Time to Buy Cardano?
On August 5th, the CRV price showed a high wick rejection at $0.636 indicating the sellers are defending this horizontal resistance. The overhead supply pressure could be triggered sideways above the $0.56 support. Therefore, interested traders can take staggered entry as the price break each resistance barrier such as $0.636, followed by $0.712, the channel pattern’s trendline.
- Moving Average Convergence Divergence: The MACD(blue) and signal line(orange) gradually close for a bullish crossover signal the increase bullish momentum.0
- Exponential Moving Average: The coin price moving below the daily EMAs(20, 50, 100, and 200) indicates the buyers would face multiple barriers to rise higher.

Why Trust CoinGape
CoinGape has covered the cryptocurrency industry since 2017, aiming to provide informative insights Read more…to our readers. Our journal analysts bring years of experience in market analysis and blockchain technology to ensure factual accuracy and balanced reporting. By following our Editorial Policy, our writers verify every source, fact-check each story, rely on reputable sources, and attribute quotes and media correctly. We also follow a rigorous Review Methodology when evaluating exchanges and tools. From emerging blockchain projects and coin launches to industry events and technical developments, we cover all facets of the digital asset space with unwavering commitment to timely, relevant information.