DOGE Price Analysis: Should You Buy Dogecoin at $0.06 Dip?


DOGE Price Analysis: Amidst the growing bearish sentiment in the cryptocurrency market, Dogecoin has undergone a corrective phase after hitting a high of $0.0838. The V-top reversal registered a 24% loss in the last two weeks and is currently trading at a price of $0.0738. With no major sign of reversal, this popular memecoin could witness further downfall.
Also Read: New Whale Transfers $16 Million Worth Of DOGE From Robinhood
Dogecoin Daily Chart: Key Points
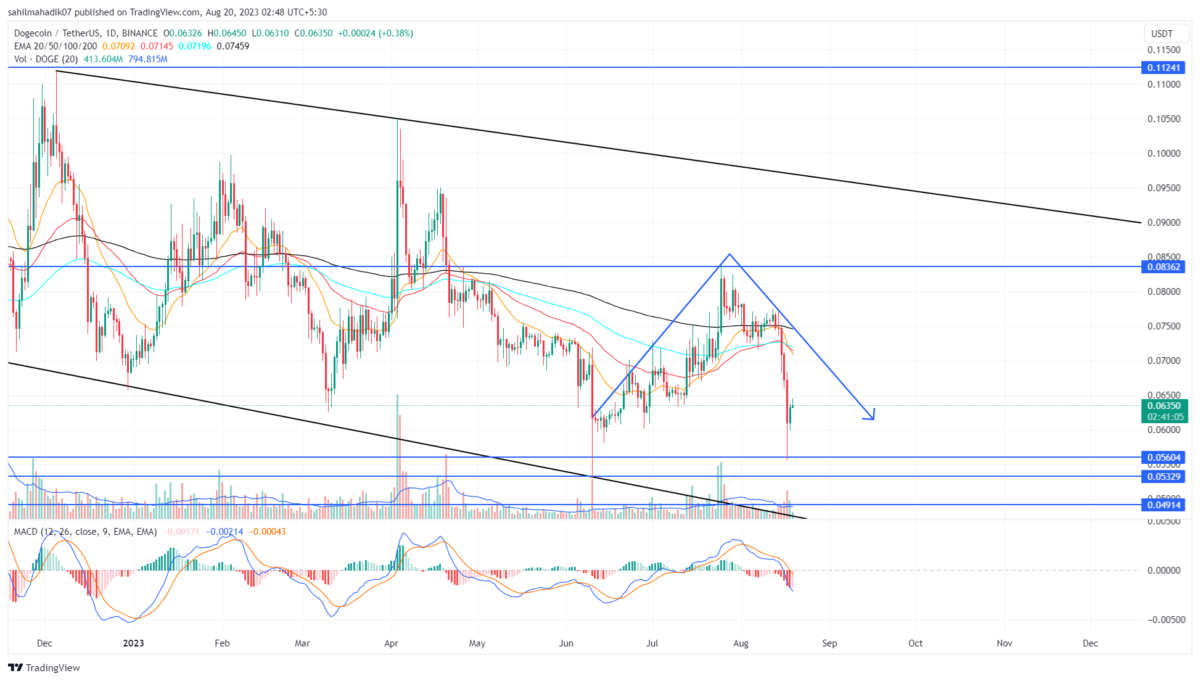
- The Dogecoin price could witness a high demand pressure at $0.056
- A bullish bearish crossover between the 50-and-100-day EMA could attract more sellers in the market
- The 24-hour trading volume in the Dogecoin coin is $263.5 Million, indicating a 65% loss
 Source-Tradingview
A V-top reversal is often marked by aggressive selling pressure in the financial market. The Dogecoin downfall backed by increasing volume indicates additional confirmation of sellers’ conviction to chase lower prices.
As of now, the DOGE price is wobbling above local support of $0.056, witnessing demand pressure from the discounted prices. After a sharp drop, the coin price is likely to show short consolidation to recuperate the selling momentum.
If the market trend remains bearish Dogecoin sellers could attempt to break the last swing low of $0.0533. This breakdown will signal a continuation of the prevailing downfall, potentially pushing the price back to $0.049, followed by $0.041.
Can Dogecoin Rise Back to $0.0838?
On August 17th, Dogecoin printed a long-bearish candle in response to the Bitcoin dip. If the coin manages to sustain above $0.0533, the buyers must breach the high of the aforementioned candle which is $0.838. This breakout will bolster buyers for a 32% upswing to challenge the $0.0838 mark.
- Exponential moving average: The coin price trading below the daily EMAs (20, 50, 100, and 200) reflects the long-term trend as bearish.
- Moving Average Convergence Divergence: A negative crossover state between the MACD(blue) and signal(orange) indicates sustained selling for the correction phase.

Why Trust CoinGape
CoinGape has covered the cryptocurrency industry since 2017, aiming to provide informative insights Read more…to our readers. Our journal analysts bring years of experience in market analysis and blockchain technology to ensure factual accuracy and balanced reporting. By following our Editorial Policy, our writers verify every source, fact-check each story, rely on reputable sources, and attribute quotes and media correctly. We also follow a rigorous Review Methodology when evaluating exchanges and tools. From emerging blockchain projects and coin launches to industry events and technical developments, we cover all facets of the digital asset space with unwavering commitment to timely, relevant information.

Related Articles


- Trump Tariffs: U.S. Threatens Higher Tariffs After Supreme Court Ruling, BTC Price Falls
- Fed’s Chris Waller Says Support For March Rate Cut Will Depend On Jobs Report
- Breaking: Tom Lee’s BitMine Adds 51,162 ETH Amid Vitalik Buterin’s Ethereum Sales
- Breaking: Michael Saylor’s Strategy Makes 100th Bitcoin Purchase, Buys 592 BTC as Market Struggles
- Satoshi-Era Whale Dumps $750M BTC as Hedge Funds Pull Out Billions in Bitcoin
- Top 3 Meme Coins Price Prediction As BTC Crashes Below $67k
- Top 4 Reasons Why Bitcoin Price Will Crash to $60k This Week
- COIN Stock Price Prediction: Will Coinbase Crash or Rally in Feb 2026?
- Shiba Inu Price Feb 2026: Will SHIB Rise Soon?
- Pi Network Price Prediction: How High Can Pi Coin Go?
- Dogecoin Price Prediction Feb 2026: Will DOGE Break $0.20 This month?


