 Buy $GGs
DOGE Price Prediction: Will $0.06 Support Serve as a Springboard for Renewed Rally?


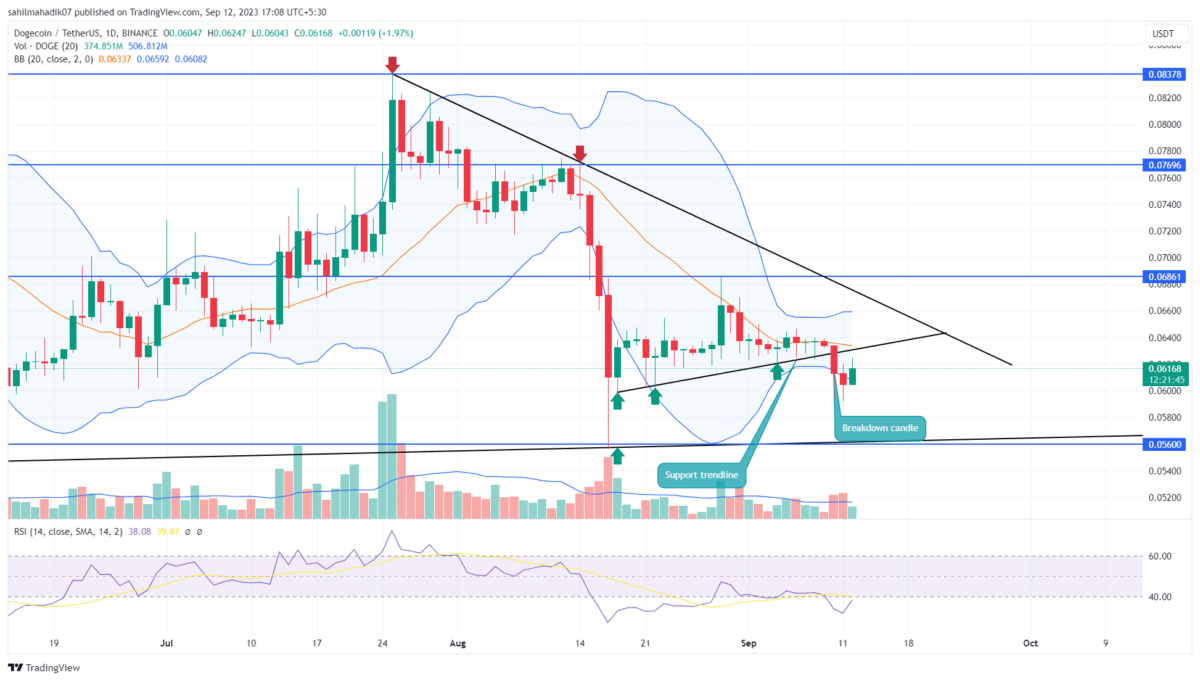
In recent days, the broader altcoin market has experienced noticeable sell-offs, and Dogecoin has been no exception. On September 10th, Dogecoin price dipped, breaking away from a dynamic support trend that had previously held firm for almost three weeks. This trend had been acting as a gentle cushion for DOGE, but its breach signaled a potential continuation of the bearish momentum threatening the memecoin of losing the $0.06 mark.
Also Read: DOGE Price Prediction: Where Is Dogecoin Heading After Today’s 6% Drop?
Post-Breakdown Fall May Push DOGE Price to $0.056
- Support trendline breakdown sets DOGE price fall by 8.5%
- The crypto holders are witnessing high demand pressure near $0.06
- The 24-hour trading volume in the Dogecoin coin is $266.5 Million, indicating a 12% gain
 Source-Tradingview
The ongoing correction in Dogecoin price has witnessed an increased demand pressure near the $0.06 mark. This demand was evident as prices saw minor rejections on the downside in the subsequent days, paving the way for a retest.
With an intraday hike of 2.3%, DOGE price value edged up to a trading price of $0.061. This move is crucial as it will determine whether the earlier support, now potentially turned resistance, is strong enough to bolster further declines.
If sellers maintain their grip, we might see Dog-themed memecoin dropping by another 8%, taking aim at the $0.056 mark.
[converter id=”doge-dogecoin” url=”https://coingape.com/price/converter/doge-to-usd/?amount=1″]
Can Dogecoin Reclaim $0.06 Mark?
While current signals lean towards a bearish trajectory for Dogecoin, the prevailing uncertainty and FUD in the crypto space hint at a potential counter-trend move. Should buyers successfully challenge and surpass the previously indicated trendline, especially the $0.064 resistance level, it would counteract the bearish narrative. This could serve as a catalyst, paving the way for the coin to solidify its position back in the $0.06 range.
- Relative Strength Indicator: The daily RSI slope below 40% ensures the sellers’ strength for a further downfall
- Bollinger Band: The lower band of the Bollinger Band indicator challenged on the downside indicates the overall selling momentum persists.
Play 10,000+ Casino Games at BC Game with Ease
- Instant Deposits And Withdrawals
- Crypto Casino And Sports Betting
- Exclusive Bonuses And Rewards


Why Trust CoinGape
CoinGape has covered the cryptocurrency industry since 2017, aiming to provide informative insights Read more…to our readers. Our journal analysts bring years of experience in market analysis and blockchain technology to ensure factual accuracy and balanced reporting. By following our Editorial Policy, our writers verify every source, fact-check each story, rely on reputable sources, and attribute quotes and media correctly. We also follow a rigorous Review Methodology when evaluating exchanges and tools. From emerging blockchain projects and coin launches to industry events and technical developments, we cover all facets of the digital asset space with unwavering commitment to timely, relevant information.

Related Articles


- Crypto Market Bill Hits New Deadlock as Banks Reject White House Deal
- Why Experts Are Warning Bitcoin Rally Could Be A “Dead Cat Bounce”
- BTC and Gold Price Bounce as Trump Admin Brokers US-Venezuela 1000 Kg Gold Deal
- SEC Advances Major Crypto Securities Plan to White House for Approval
- Peter Brandt Flips Bullish, Predicts Bitcoin Rally As Price Holds Above $70k
- XRP Price As Bitcoin Reclaims $74K- Is $5 Next?
- Dogecoin Price Outlook as BTC Recovers Above $73,000
- XRP Price Prediction as Iran-U.S. Peace Talks Trigger a Crypto Rally
- COIN Stock Analysis as Bitcoin Retests $72k Ahead of February NFP Data
- Robinhood Stock Price Prediction As Cathie Wood Buys $12M Dip in Bold ARK Move
- Bitcoin Price At Risk? Professor Who Predicted US-Iran War Says America Could Lose


