DOGE Price Prediction: Will Dogecoin Lose $0.06 Mark to Rising Market FUD?


Amid the recent altcoin market selloff, the popular memecoin DOGE wasn’t spared as it succumbed to significant outflows on September 10th. Notably, this drop sent the coin price below the critical support trendline which carried a relief rally for over three weeks. Such a breakdown typically signals a continuation of the downtrend, suggesting DOGE price is poised for further fall.
Also Read: US CPI Inflation Jumps 3.7%, How’s The Crypto Market Faring?
Key Support Breakdown Point to Prolong Correction
- A support breakdown has been set to extend the downward course by 8%
- The DOGE price is likely to witness strong demand pressure at $0.065
- The intraday trading volume in the DOGE is $198 Million, indicating a 7% loss
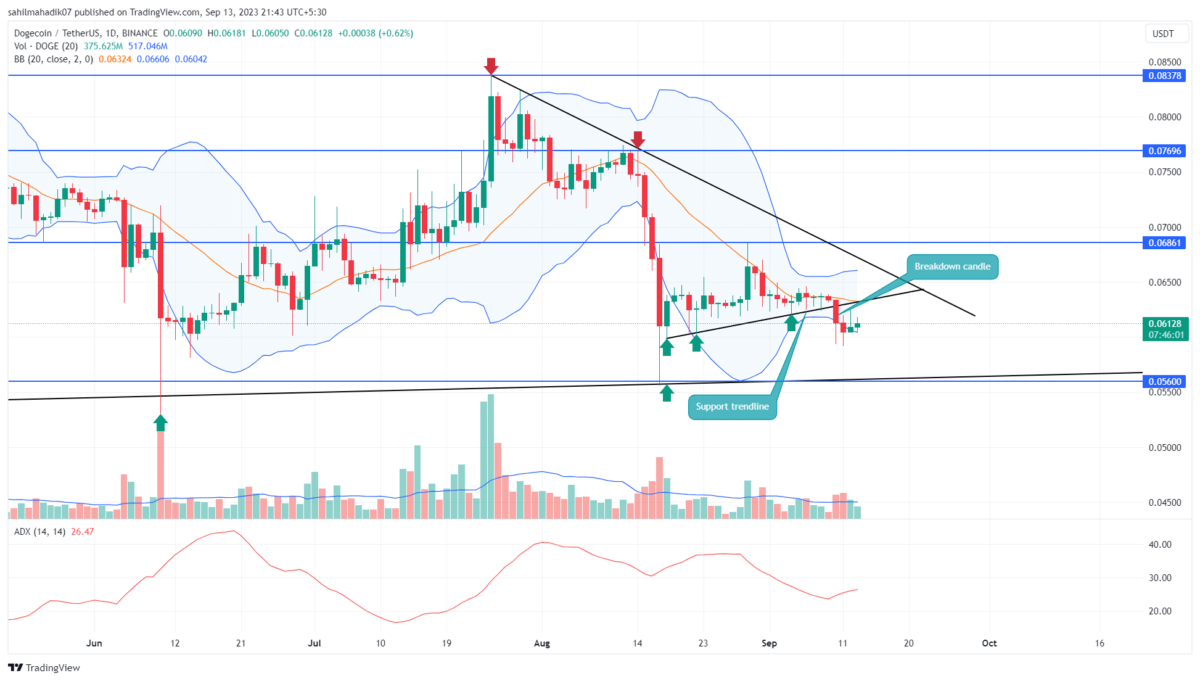
 Source: Tradingview
In the preceding weeks, the Dogecoin price moved largely sideways but witnessed strong support from an ascending trendline. This memecoin obtained a surge in buying pressure every time it dipped to this support, carrying a relief rally in the daily chart. This setup often emerges in an established downtrend and recuperates the selling pressure for further downfall.
Come September 11th, the DOGE price decisively broke below the support trendline, diving to a $0.0593 low. However, the bulls were quick to react, pushing the price up in a retest of the now-resistance trendline. At the time of writing, the Dog-themed coin stands at $0.061, and the price rejection wick at the top reflects the overhead supply pressure.
If this retest phase shows price sustainability below the trendline, this coin price might see an additional decline of roughly 8%, targeting the $0.056 zone.
[converter id=”doge-dogecoin” url=”https://coingape.com/price/converter/doge-to-usd/?amount=1″]
Can DOGE Price Regain Trend Control?
Despite its severity, the bearish candle on September 10th, lacked substantial follow-through in subsequent days, hinting at potential bearish exhaustion. Should the buyers regain control and push DOGE above $0.0636, it would likely invalidate the recent breakdown, potentially marking it as a bear trap. Such a development could reignite buying interest, shifting the momentum back in favor of the bulls.
- Bollinger Band: A downtick in the lower band of the Bollinger Band indicator shows the selling momentum is active.
- Average Directional Index: The ADX slope at 26% indicates the sellers have enough fuel to prolong the ongoing downtrend.

Why Trust CoinGape
CoinGape has covered the cryptocurrency industry since 2017, aiming to provide informative insights Read more…to our readers. Our journal analysts bring years of experience in market analysis and blockchain technology to ensure factual accuracy and balanced reporting. By following our Editorial Policy, our writers verify every source, fact-check each story, rely on reputable sources, and attribute quotes and media correctly. We also follow a rigorous Review Methodology when evaluating exchanges and tools. From emerging blockchain projects and coin launches to industry events and technical developments, we cover all facets of the digital asset space with unwavering commitment to timely, relevant information.

Related Articles


- Breaking: Michael Saylor’s Strategy Makes 100th Bitcoin Purchase, Buys 592 BTC as Market Struggles
- Satoshi-Era Whale Dumps $750M BTC as Hedge Funds Pull Out Billions in Bitcoin
- XRP Sees Largest Realized Loss Since 2022, History Points to Bullish Price Run: Report
- US Strike on Iran Possible Within Hours: Crypto Market on High Alert
- MetaSpace Will Take Its Top Web3 Gamers to Free Dubai Trip
- Top 3 Meme Coins Price Prediction As BTC Crashes Below $67k
- Top 4 Reasons Why Bitcoin Price Will Crash to $60k This Week
- COIN Stock Price Prediction: Will Coinbase Crash or Rally in Feb 2026?
- Shiba Inu Price Feb 2026: Will SHIB Rise Soon?
- Pi Network Price Prediction: How High Can Pi Coin Go?
- Dogecoin Price Prediction Feb 2026: Will DOGE Break $0.20 This month?


