Dogecoin Price Analysis: Last Pullback Before $DOGE Price Triggers 22% Rally?


Dogecoin Price Analysis: Contrary to the market leaders Bitcoin and Ethereum who prolong their correction phase, the Dogecoin price rides its recovery rally to higher chart levels. By press time, the Dog-themed memecoin trades at $0.077 registering a 45% gain within the last six weeks. In addition, the memecoin witnessed a significant inflow on July 25th and gave a massive breakout from the $0.075 resistance. Can this breakout prolong the recovery trend?
Also Read: ChatGPT Says Pomerdoge, Pepe And Dogecoin Will Be The Top Meme Coins In 2023 / 2024
Dogecoin Price Daily Chart
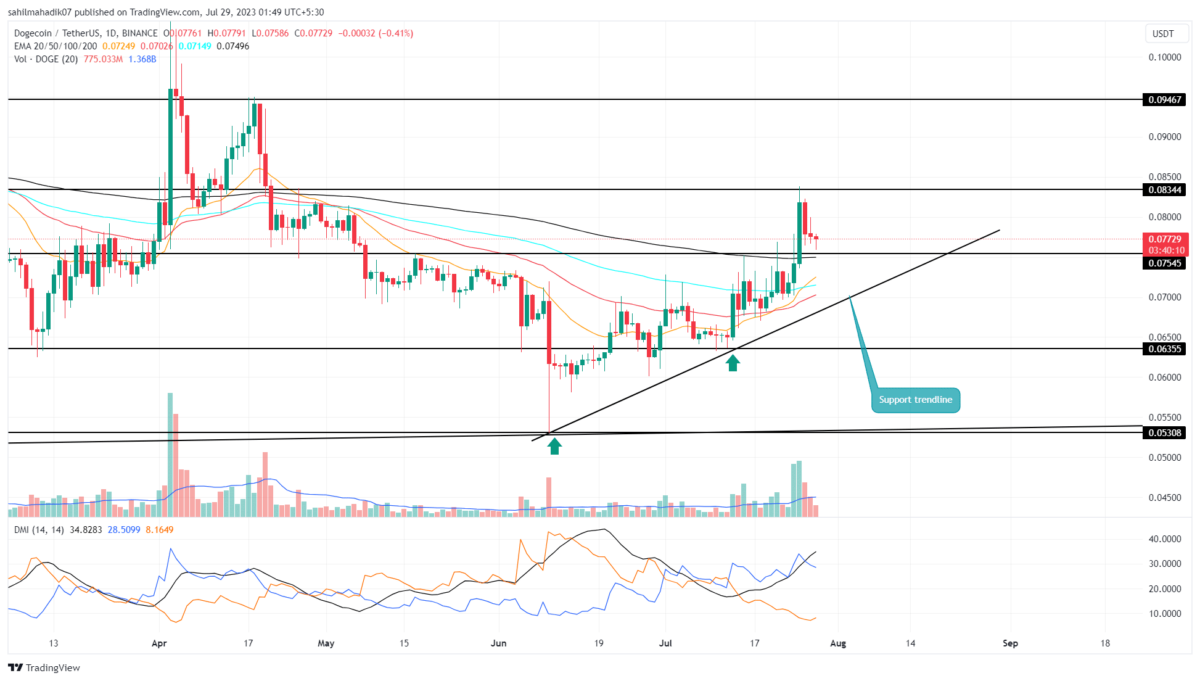
- A Dogecoin price could witness high demand pressure from the $0.075 support
- A bullish crossover between the 50-and-100-day EMAs may attract more buyers in the market.
- The 24-hour trading volume in the Dogecoin coin is $383.5 Million, indicating a 31% gain
 Source-Tradingview
The ongoing recovery rally in Dogecoin price gave a bullish breakout from the $0.0755 monthly barrier. The breakout candle backed by high volume indicates the buyer’s strong conviction to reclaim higher growth.
However, after making a high of $0.083, the coin price reverted and tried to retest the breached level as potential support. The daily candle today with long lower price detection indicates the buyers are defending the flipped support
With sustained buyers, the buyers could lead the recovery rally 22% higher to hit the $0.095 barrier.
[converter id=”doge-dogecoin” url=”https://coingape.com/price/converter/doge-to-usd/?amount=1″]
What is DOGE Price Loses $0.072 Support?
If the broader market sentiment continues to pressurize the Dogecoin price, the coin holders could witness a sideways above $0.072 or a breakdown below it. However, the buyers hold a rising trendline which offers dynamic support to buyers amid the current recovery. Until this trendline is intact, the traders can maintain their bullish sentiment.
- Exponential moving average: With the recent breakout, the coin reclaims the 200-day EMAs support offering an additional edge to long buyers.
- Directional moving index: A significant gap between the DI+(blue) and DI-(orange) slope in a positive crossover state indicates a strong momentum among traders.

Why Trust CoinGape
CoinGape has covered the cryptocurrency industry since 2017, aiming to provide informative insights Read more…to our readers. Our journal analysts bring years of experience in market analysis and blockchain technology to ensure factual accuracy and balanced reporting. By following our Editorial Policy, our writers verify every source, fact-check each story, rely on reputable sources, and attribute quotes and media correctly. We also follow a rigorous Review Methodology when evaluating exchanges and tools. From emerging blockchain projects and coin launches to industry events and technical developments, we cover all facets of the digital asset space with unwavering commitment to timely, relevant information.

Related Articles


- Tom Lee’s Bitmine Doubles Down on Ethereum With $34.7M Fresh Purchase
- BlackRock Buys $65M in Bitcoin as U.S. Crypto Bill Odds Passage Surge
- Bitcoin Sell-Off Ahead? Garett Jin Moves $760M BTC to Binance Amid Trump’s New Tariffs
- CLARITY Act: Trump’s Crypto Adviser Says Stablecoin Yield Deal Is “Close” as March 1 Deadline Looms
- Trump Tariffs: U.S. To Impose 10% Global Tariff Following Supreme Court Ruling
- Ethereum Price Rises After SCOTUS Ruling: Here’s Why a Drop to $1,500 is Possible
- Will Pi Network Price See a Surge After the Mainnet Launch Anniversary?
- Bitcoin and XRP Price Prediction As White House Sets March 1st Deadline to Advance Clarity Act
- Top 3 Price Predictions Feb 2026 for Solana, Bitcoin, Pi Network as Odds of Trump Attacking Iran Rise
- Cardano Price Prediction Feb 2026 as Coinbase Accepts ADA as Loan Collateral
- Ripple Prediction: Will Arizona XRP Reserve Boost Price?


