 Buy $GGs
Dogecoin Price Analysis: Will $DOGE Buyers Hold $0.06 Support As Market FUD Rises?


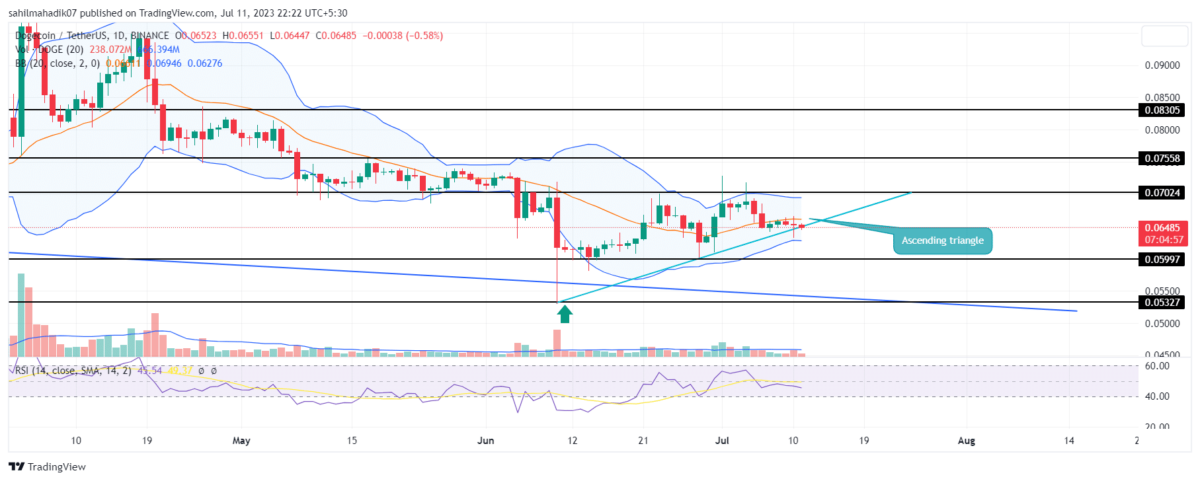
Dogecoin Price Analysis: Amid the recovery rally initiated in mid-June, the Dogecoin price rose with new higher lows and showed the formation of an ascending triangle pattern. The coin buyers are using this pattern’s rising trendline as dynamic support to maintain a bullish reversal. However, with the 0.6% intraday loss, the coin shows an attempt for a bearish breakdown from this pattern and possible price correction.
Also Read: Dogecoin Price Analysis: Will $DOGE Price Recovery Push Past $0.07 Barrier?
Dogecoin Price Daily Chart
- A breakdown below the support trendline of the triangle pattern could plunge the $DOGE price by 18.5%.
- The Bollinger Band squeezing indicates increasing market volatility
- The 24-hour trading volume in the Dogecoin coin is $204.3 Million, indicating a 0.23% gain.
 Source-Tradingview
Over the past four weeks, the eighth largest cryptocurrency-Dogecoin resonated within barriers of an ascending triangle pattern with a $0.0702 neckline resistance and support trendline. Under the influence of this pattern, the coin price witnessed gradual growth in bullish momentum and opportunity for a long opportunity.
However, amid the current uncertainty in the crypto market, the DOGE Price struggles to sustain above the support trendline. By the press time, the memecoin currently trades at 0.0654 and shows a crackdown from the lower trendline.
A bearish breakdown from the bullish pattern is a strong sell signal which could continue the prevailing downtrend in this popular memecoin. The post-breakdown fall may push the prices 18% down to hit $0.053.
[converter id=”doge-dogecoin” url=”https://coingape.com/price/converter/doge-to-usd/?amount=1″]
Will Dogecoin Price Reach $0.88 High?
If the buyers stepped in by day’s end and pushed the prices back above the trendline, the bullish pattern will remain intact. The constant support from the rising trendline will bolster buyers to challenge the $0.07 neckline resistance. This breakout will restore sufficient bullish momentum and push the prices back to the $0.088 mark.
- Bollinger Band: If the Bollinger Band indicator gets challenged on the downside the sellers may carry a high momentum fall.
- Relative Strength Index: Conversely to the new lower highs in price action, the daily RSI rising indicates the buyer’s attempts are not making a significant impact on the current trend.
Play 10,000+ Casino Games at BC Game with Ease
- Instant Deposits And Withdrawals
- Crypto Casino And Sports Betting
- Exclusive Bonuses And Rewards


Why Trust CoinGape
CoinGape has covered the cryptocurrency industry since 2017, aiming to provide informative insights Read more…to our readers. Our journal analysts bring years of experience in market analysis and blockchain technology to ensure factual accuracy and balanced reporting. By following our Editorial Policy, our writers verify every source, fact-check each story, rely on reputable sources, and attribute quotes and media correctly. We also follow a rigorous Review Methodology when evaluating exchanges and tools. From emerging blockchain projects and coin launches to industry events and technical developments, we cover all facets of the digital asset space with unwavering commitment to timely, relevant information.

Related Articles


- Senate Eyes CLARITY Act Markup This Month as Banks, Crypto Continue Stablecoin Yield Talks
- Why XRP Price Rising Today? (2 March)
- Breaking: Bitcoin Price Rises to $70k as Gold Crashes Amid U.S.-Iran Conflict
- Bitcoin News: Anthony Pompliano’s ProCap Buys 450 BTC, Gold Bug Peter Schiff Reacts
- Fed Rate Cuts More Likely If U.S.-Iran Conflict Extends, Arthur Hayes Predicts
- Top 5 Historical Reasons Dogecoin Price Is Not Rising
- Pi Coin Price Prediction for March 2026 Amid Network Upgrade, KYC Boost, Rewards Distribution
- Gold Price Nears ATH; Silver Eyes $100 Breakout on Us- Iran War
- Bitcoin And XRP Price As US Kills Iran Supreme Leader- Is A Crypto Crash Ahead?
- Gold Price Prediction 2026: Analysts Expect Gold to Reach $6,300 This Year
- Circle (CRCL) Stock Price Prediction as Today is the CLARITY Act Deadline


