Dogecoin Price Analysis: Will $DOGE Price Recovery Push Past $0.07 Barrier?


Dogecoin Price Analysis: On July 1st, the Dogecoin price gave a bullish breakout from a downsloping trendline as a signal for potential recovery. However, as the positive sentiment built around spot Bitcoin ETF fades, the crypto market witnessed a downturn in mid-weeks, and several major cryptocurrencies halted their recovery rally. Thus, the popular Memecoin DOGE plunged back to the breached trendline proving its sustainability for the higher prices.
Also Read: Dogecoin Price Recovers After Largest DOGE Shorting of 2023
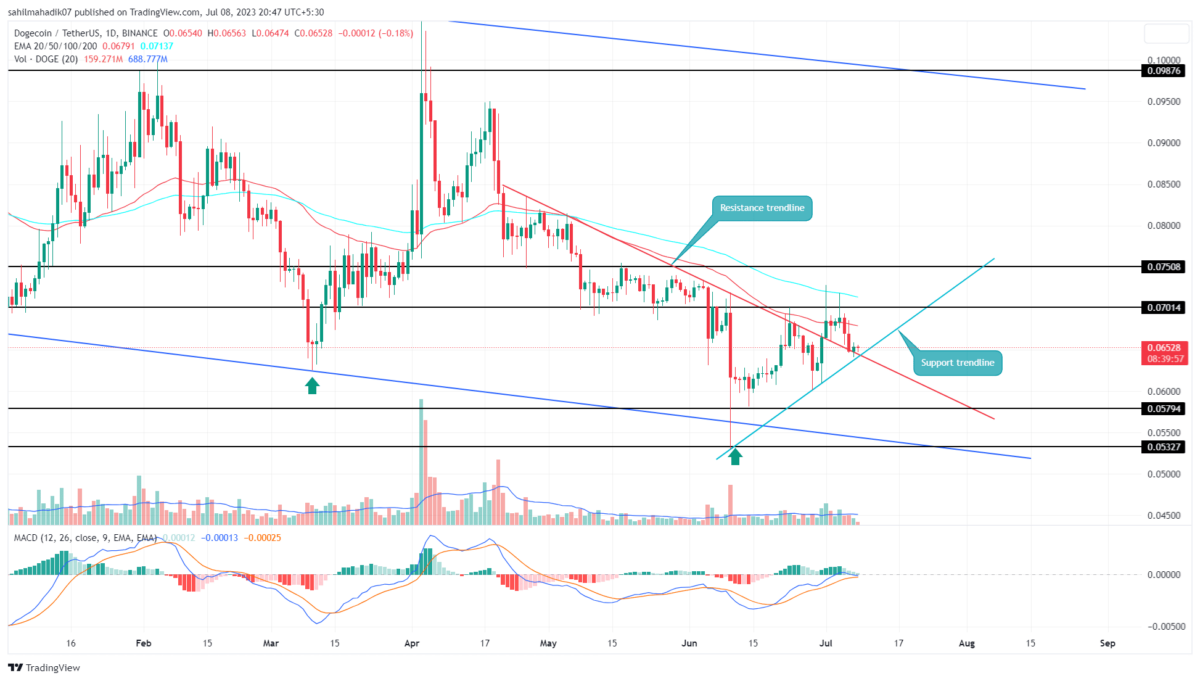
Dogecoin Price Daily Chart
- A breakdown below the support trendline could set the $DOGE price for an 8.5% drop.
- The 100-day EMAs dynamic tries to maintain a higher bearish trend
- The 24-hour trading volume in the Dogecoin coin is $152.3 Million, indicating a 30% loss.
 Source-Tradingview
During early July, the Dogecoin buyers showed the first sign of weakness as prices failed to sustain above the last swing high barrier of $0.7. With negative sentiment in the market, the resulting pullback has plunged the coin price to $0.065, where it currently hovers above the confluence of the rising support trendline and recently breached the resistance trendline.
This confluence should offer suitable support for buyers to recuperate bullish momentum. Interested traders can wait for a few days and check price stability at this level before initiating a fresh long position.
A strong bullish candle at this retest could trigger an entry opportunity and an increased possibility to rechallenge $0.07. With sustained buying, the coin price can expect a resistance zone at $0.075, and $0.085.
Will Dogecoin Price Retake $0.75 High?
If the bearish momentum in the market persists, a breakdown below the support confluence of the two aforementioned trendlines could project a significant sell signal. A daily candle closing below these trendlines will offer sellers an additional barrier to pressurize prices. The potential downfall could plunge the popular memecoin 8.5% down to reach $0.058, followed by $0.053.
- Exponential Moving Average: The daily EMAs(20, 50, 100, and 200) moving above the DOGE price indicating the traders would face the least resistance on the downside.
- Moving Average Convergence Divergence: A reverse bearish divergence in the indicator’s daily chart, where the MACD(blue) and signal(orange) make higher highs and price action make lower lows indicating the buyer’s attempts are getting nullified.

Why Trust CoinGape
CoinGape has covered the cryptocurrency industry since 2017, aiming to provide informative insights Read more…to our readers. Our journal analysts bring years of experience in market analysis and blockchain technology to ensure factual accuracy and balanced reporting. By following our Editorial Policy, our writers verify every source, fact-check each story, rely on reputable sources, and attribute quotes and media correctly. We also follow a rigorous Review Methodology when evaluating exchanges and tools. From emerging blockchain projects and coin launches to industry events and technical developments, we cover all facets of the digital asset space with unwavering commitment to timely, relevant information.