Dogecoin Price Forecast: Is $0.3 Next After Symmetrical Triangle Breakout?


Highlights
- Symmetrical triangle nearing apex signals potential breakout for Dogecoin.
- Bullish TD Sequential indicator promises to form bottoms in the short-term.
- The presence of large holder sell-off exerts pressure and hinders any bullish recovery.
Dogecoin price is holding above the $0.16 support level, showing signs of stabilization after recent volatility. DOGE opens a symmetrical triangle at the moment which analysts are closely monitoring as typically the pattern is followed by significant breakouts. The meme-based token has struggled to recover after slipping below the $0.20 level earlier this week
In the meantime, the entire crypto market was up 1.44% over the last 24 hours, regaining some of its week-long losses of 7.98% with renewed institutional activity and hopes of stablecoin regulation.
Dogecoin Price Nears Breakout from Symmetrical Triangle Pattern
Dogecoin price is demonstrating a typical technical structure on the daily chart, which indicates possible change of momentum. Analysts have also found a huge symmetrical triangle pattern which is approaching the apex a point where the compression of prices will likely increase volatility.
Currently, the price of Dogecoin is located on the lower end of this structure. The zone is normally considered to be a highly promising zone of strengthening rebounds, which may lead to an improvement in the upward direction provided that there is increased buying pressure.
According to market observers, symmetrical triangles are a precursor of big breakouts. Any decisive action above the highest trend might initiate a quickened rise that may see Dogecoin towards the $0.35 or even greater. This breakout can also suggest the onset of a new impulse wave of the overall trend.
$DOGE is sitting right on the lower trendline of the symmetrical triangle.
This area has acted as a strong floor for months, and buying pressure is starting to build.
A clean bounce here could send $DOGE soon. pic.twitter.com/OoghaTx43A
— Crypto King (@CryptoKing4Ever) November 6, 2025
DOGE Price Shows Possible Rebound as Buy Signal Appears
Dogecoin price can be exhibiting the initial signs of recovery following a recent technical indicator that has indicated a possible buy signal. Crypto analyst Ali noted that the TD sequential indicator is a bullish signal of DOGE, indicating that a possible local bottom had been reached. This trend indications chart presented on the TradingView indicates a pattern reversal formation which might indicate a short-term upward trend in the mainstream meme coin.
TD flashes buy on Dogecoin $DOGE. Local bottom might be in! pic.twitter.com/g84k4FtO5d
— Ali (@ali_charts) November 5, 2025
Nevertheless, the market is not very optimistic. In another update, Ali disclosed that over one billion Dogecoins were sold by big holders in the last one week. Major selling by large investors has put extra strain on the price of the token, despite a speculation on a recovery by smaller traders.
Over 1 billion Dogecoin $DOGE sold by whales in the past week! pic.twitter.com/pjUwFAqtEM
— Ali (@ali_charts) November 4, 2025
Will DOGE Price Recover Above $0.25?
The latest DOGE price traded at $0.162, showing mild bearish pressure in the short term.
The price of Dogecoin has been consolidating following a recent fall that reached the zone of resistance of $0.18. The 4-hour chart reflects that sellers have a slight control. In spite of the recovery efforts, purchase momentum is still low, and prices have not been able to recover to higher levels.
In case Dogecoin drops below the level of $0.15, the potential support point is close to the level of $0.14. Alternatively, the reclaimation of the $0.20 might lead to the way to the $0.35 level as the long-term Dogecoin price shows the bullish trend in the near term.
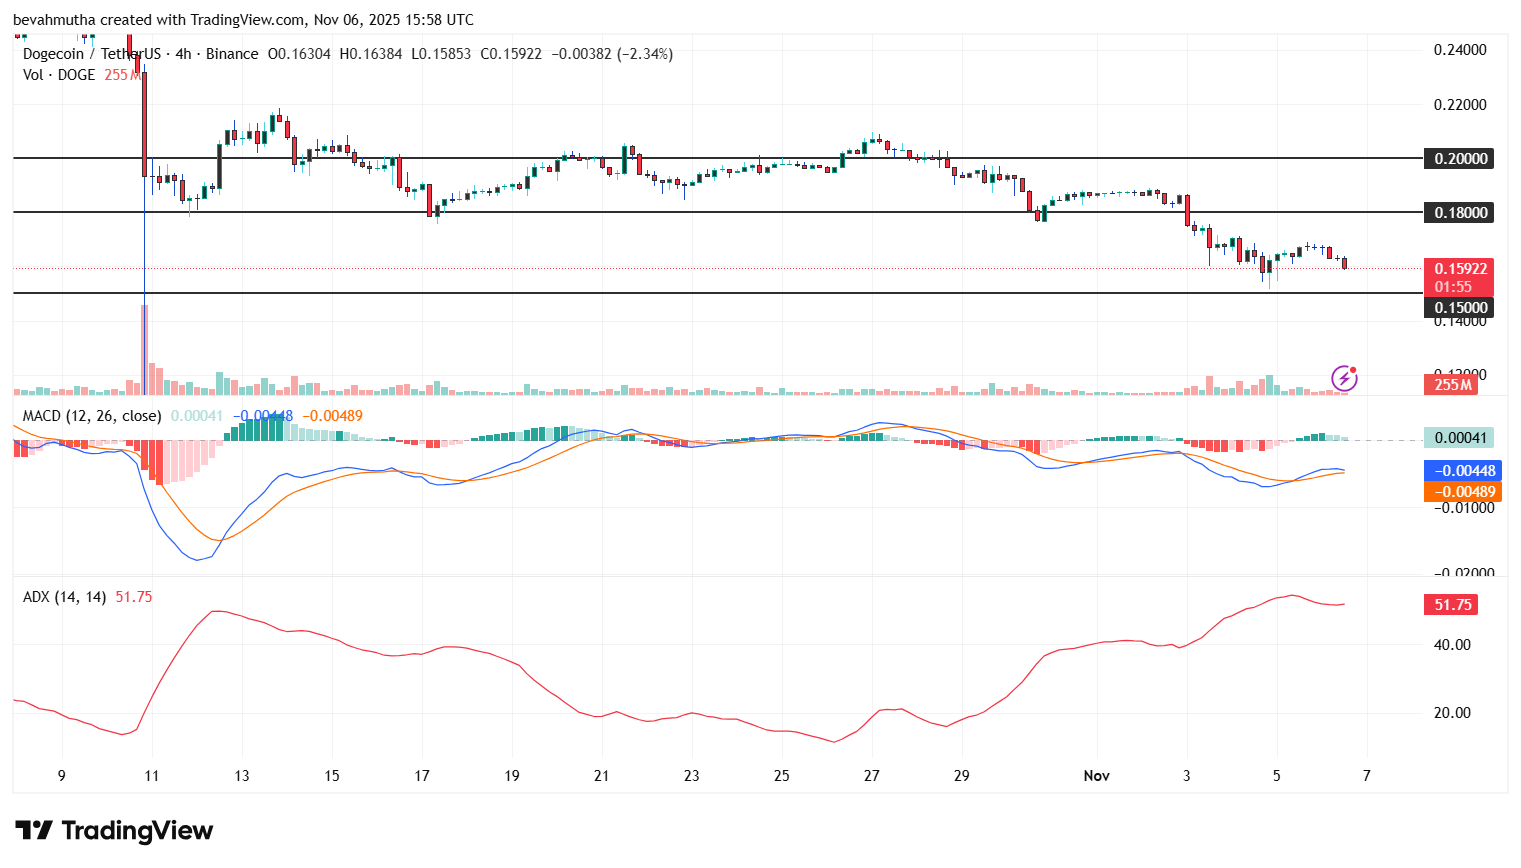
The Moving Average Convergence Divergence (MACD) has a slight bullish crossover. Nonetheless, the histogram bars remain low indicating low power in upside movement.The average directional index (ADX) is approximately 51 which is an indication that there is a strong trend.
Frequently Asked Questions (FAQs)
1. What factors could push Dogecoin above $0.25?
2. What is a symmetrical triangle pattern in crypto charts?

Why Trust CoinGape
CoinGape has covered the cryptocurrency industry since 2017, aiming to provide informative insights Read more…to our readers. Our journal analysts bring years of experience in market analysis and blockchain technology to ensure factual accuracy and balanced reporting. By following our Editorial Policy, our writers verify every source, fact-check each story, rely on reputable sources, and attribute quotes and media correctly. We also follow a rigorous Review Methodology when evaluating exchanges and tools. From emerging blockchain projects and coin launches to industry events and technical developments, we cover all facets of the digital asset space with unwavering commitment to timely, relevant information.

Related Articles


- XRP Realized Losses Spike to Highest Level Since 2022, Will Price Rally Again?
- Crypto Market Rises as U.S. and Iran Reach Key Agreement On Nuclear Talks
- Trump Tariffs: U.S. Raises Global Tariff Rate To 15% Following Supreme Court Ruling
- Bitwise CIO Names BTC, ETH, SOL, and LINK as ‘Mount Rushmore’ of Crypto Amid Market Weakness
- Prediction Market News: Kalshi Faces New Lawsuit Amid State Regulatory Crackdown
- Pi Network Price Prediction: How High Can Pi Coin Go?
- Dogecoin Price Prediction Feb 2026: Will DOGE Break $0.20 This month?
- XRP Price Prediction As SBI Introduces Tokenized Bonds With Crypto Rewards
- Ethereum Price Rises After SCOTUS Ruling: Here’s Why a Drop to $1,500 is Possible
- Will Pi Network Price See a Surge After the Mainnet Launch Anniversary?
- Bitcoin and XRP Price Prediction As White House Sets March 1st Deadline to Advance Clarity Act


