 Buy $GGs
Dogecoin Price Forms Falling Wedge Pattern Amid 41,132 Transactions; What Next For DOGE?


Highlights
- Dogecoin price forms a falling wedge pattern amid market correction.
- Over 41,000 transactions processed, showing varied demand for DOGE.
- Bearish momentum suggests a potential decline toward $0.1 support level.
Dogecoin (DOGE) price displayed a falling wedge pattern after the crypto market correction. The cryptocurrency field has undergone major liquidation events that resulted in over $450 million worth of assets being sold over the previous day. The trading value of DOGE maintains a bearish direction as it hovers below $0.17 support. The market challenges continue to affect DOGE tokens as the total number of transactions 41,132 were processed.
Dogecoin Price Forms Falling Wedge Amid 41,132 Transactions
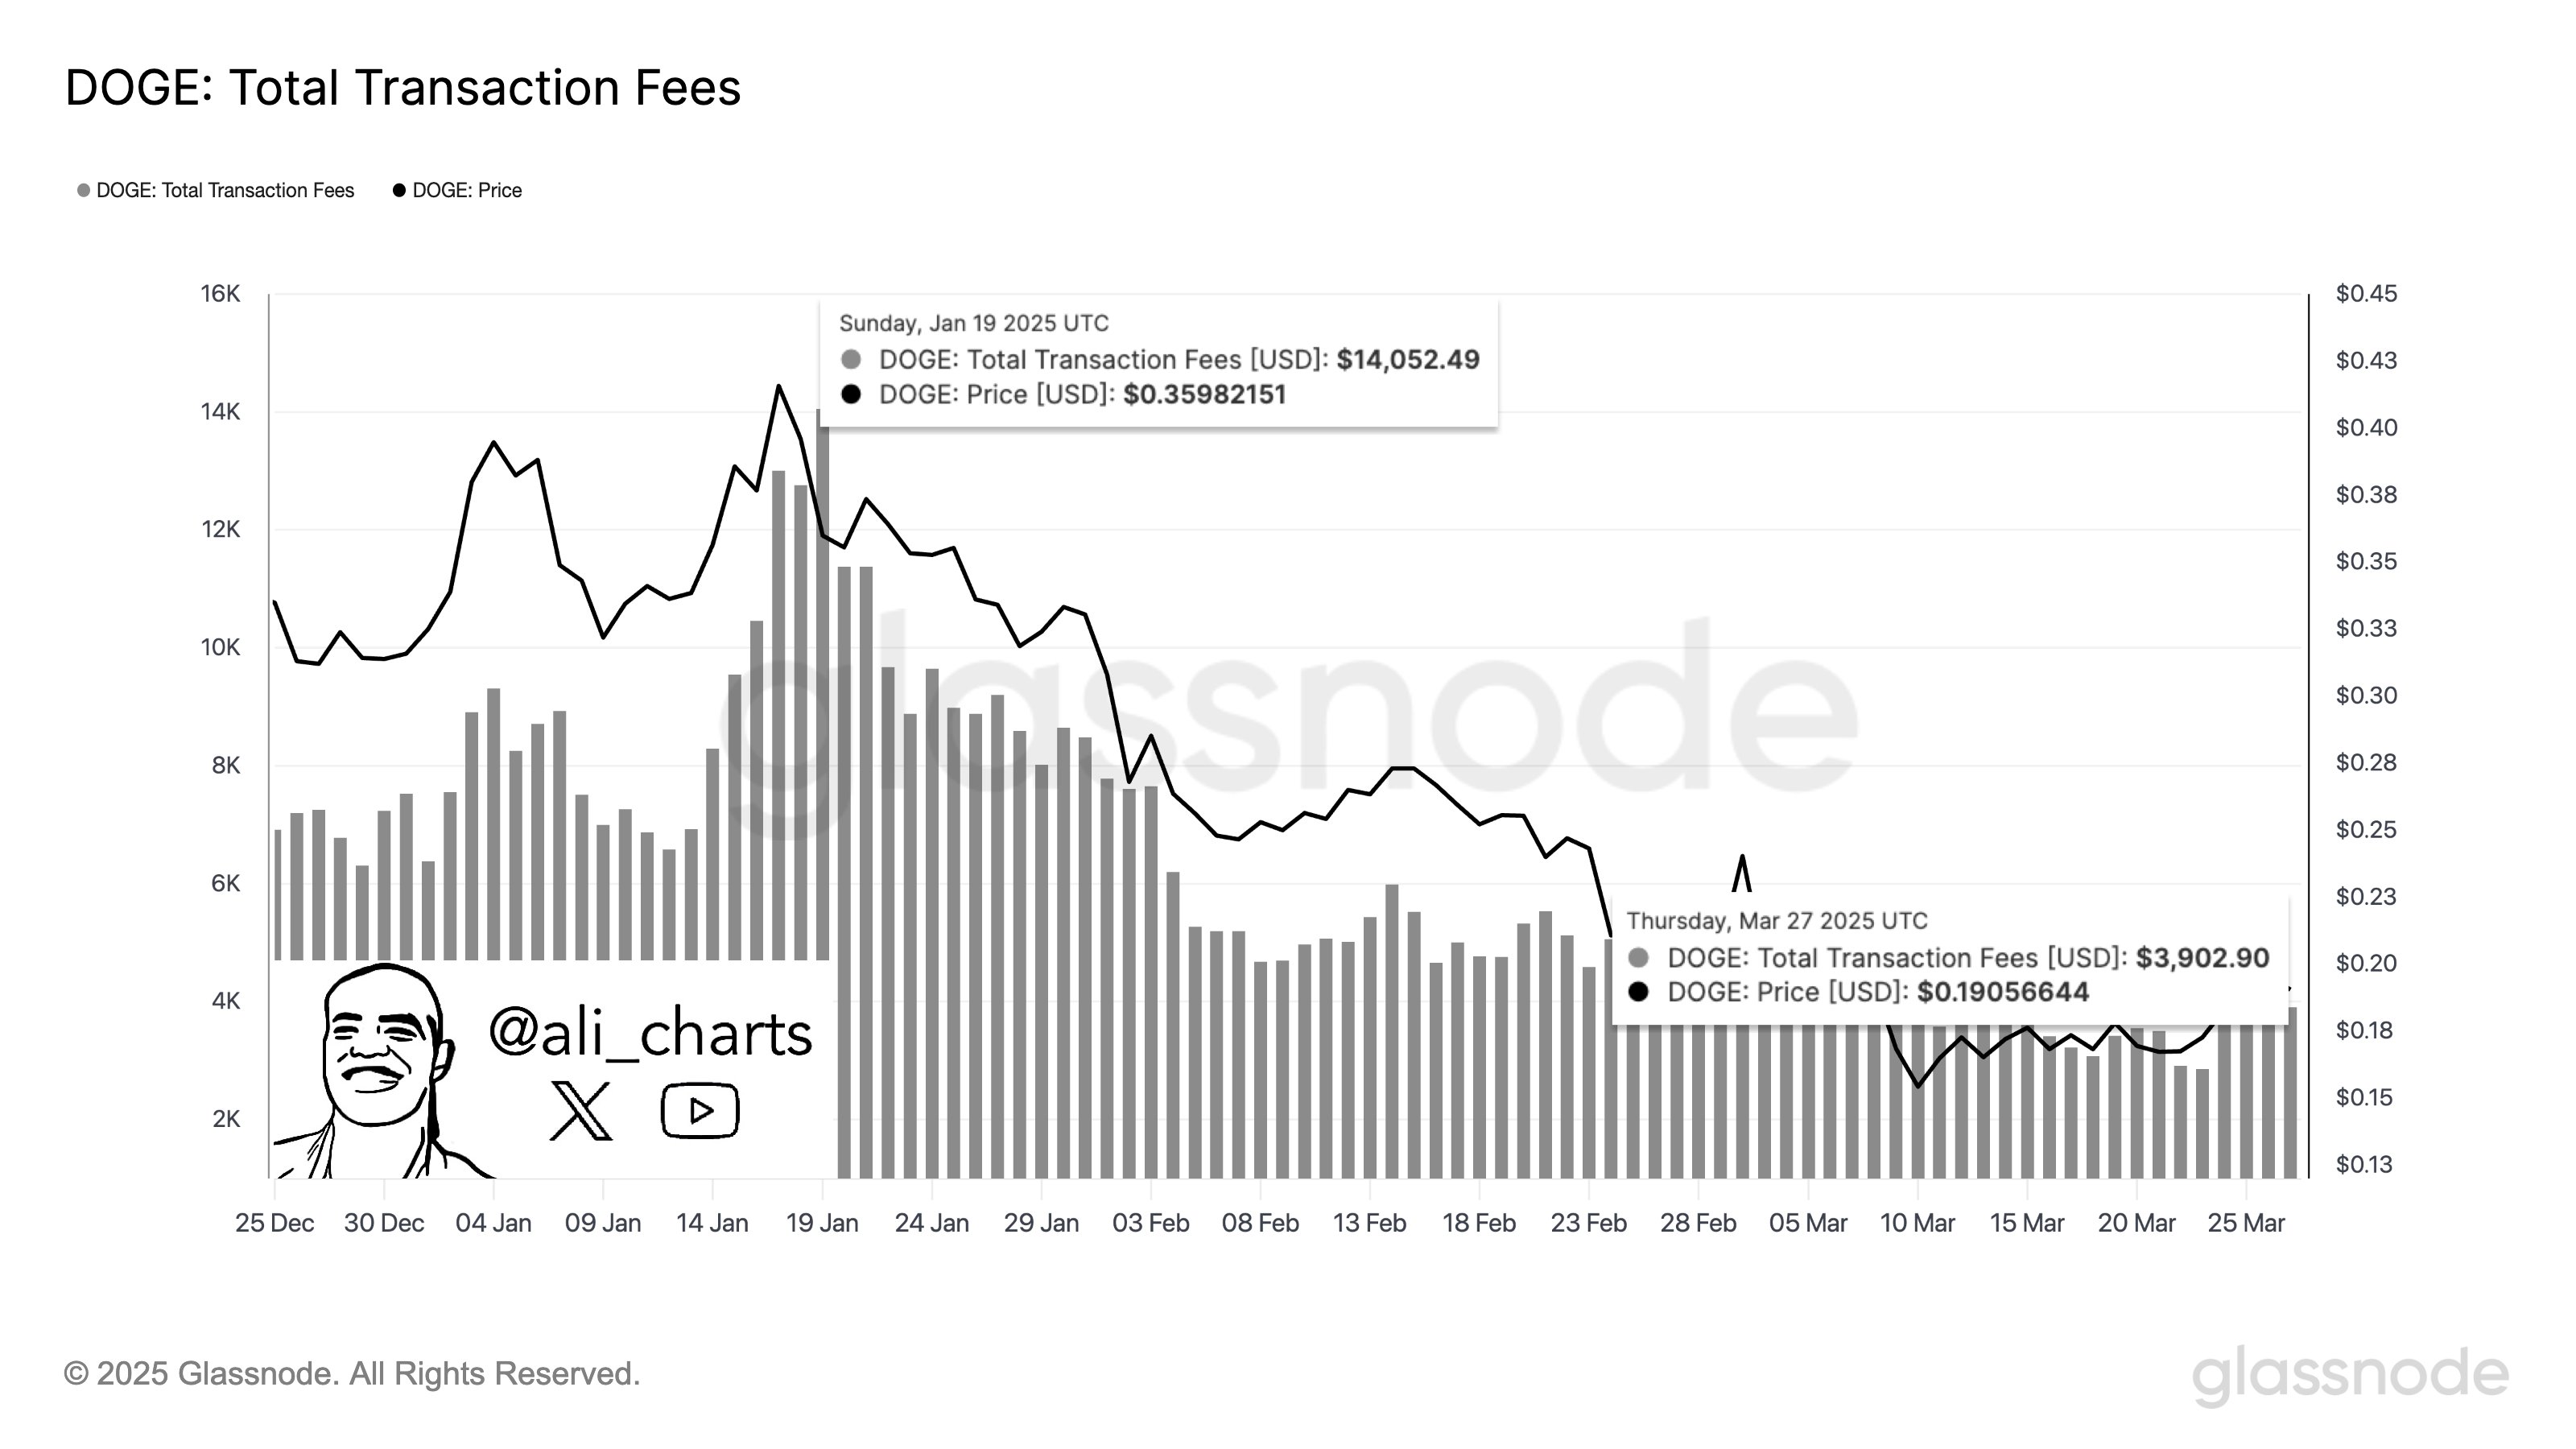
Dogecoin price has completed 41,132 transactions throughout the last 24 hours, according to a recent report by crypto analyst Ali. The average transaction cost reached 0.534 DOGE through this operation, amounting to $3,900 based on current market prices.
The data shows that Dogecoin’s transaction fees witnessed dramatic shifts in value throughout the previous week as market demand for network operations has changed considerably. The network activity information provides a vital understanding that influences how investors perceive Dogecoin in the market.
Will DOGE Price Hit $0.1 Level As Bears Gain Power?
The Dogecoin price is showing signs of a potential downward breakout, forming a Falling Wedge pattern on the 4-hour chart. This technical pattern suggests that the price could continue its descent, reaching lower price levels in the short term.
Currently, DOGE is facing resistance near the $0.18 level, with support located at $0.15. The price movement within the Falling Wedge indicates that there may be a gradual decline before a potential reversal, but this remains uncertain without further confirmation.
At the time of writing, the DOGE price is trading at $0.1709, with a 5% decrease over the past 24-hours. This Follows the decrease in other crypto markets, With BTC hovering around $83k and ETH trading below $1,9 support levels.
The Relative Strength Index (RSI) is currently hovering around 33, nearing the oversold region market sentiment.
The Moving Average Convergence Divergence (MACD) indicates signs of a weak bullish crossover which suggests that bearish momentum remains active. A possible reversal may begin when the MACD line crosses above the signal line.
Key Levels To Watch
The immediate resistance stands at $0.18, while the support level is at $0.15. If the Dogecoin price prediction breaks below the support, further decline could be expected toward the $0.14 range.

And if bears mount with strong sell, of could lead to a DOGE price decrease to $0.1 in the near term. On the other hand, a successful breakout above the resistance could lead to a return to the $0.2 area.
Play 10,000+ Casino Games at BC Game with Ease
- Instant Deposits And Withdrawals
- Crypto Casino And Sports Betting
- Exclusive Bonuses And Rewards

Frequently Asked Questions (FAQs)
1. What is the Falling Wedge pattern in DOGE?
2. What is the immediate resistance level for DOGE?
3. What support level should DOGE holders watch?

Why Trust CoinGape
CoinGape has covered the cryptocurrency industry since 2017, aiming to provide informative insights Read more…to our readers. Our journal analysts bring years of experience in market analysis and blockchain technology to ensure factual accuracy and balanced reporting. By following our Editorial Policy, our writers verify every source, fact-check each story, rely on reputable sources, and attribute quotes and media correctly. We also follow a rigorous Review Methodology when evaluating exchanges and tools. From emerging blockchain projects and coin launches to industry events and technical developments, we cover all facets of the digital asset space with unwavering commitment to timely, relevant information.

Related Articles


- Crypto Market Update: Top 3 Reasons Why BTC, ETH, XRP and ADA is Up
- Crypto News: Bitcoin Sell-Off Fears Rise as War Threatens Iran’s BTC Mining Operations
- U.S.–Iran War: Monday Crypto Crash Odds Rise As Pundits Predict Oil Price Spike
- US-Iran War: Reports Confirm Bombings In UAE, Bahrain and Kuwait As Crypto Market Makes Recovery
- XRP Price Dips on US-Iran Conflict, But Capitulation Signals March Rebound
- Bitcoin And XRP Price As US Kills Iran Supreme Leader- Is A Crypto Crash Ahead?
- Gold Price Prediction 2026: Analysts Expect Gold to Reach $6,300 This Year
- Circle (CRCL) Stock Price Prediction as Today is the CLARITY Act Deadline
- Analysts Predict Where XRP Price Could Close This Week – March 2026
- Top Analyst Predicts Pi Network Price Bottom, Flags Key Catalysts
- Will Ethereum Price Hold $1,900 Level After Five Weeks of $563M ETF Selling?


