 Buy $GGs
Dogecoin Price Prediction Hints 10% Jump Ahead, But There a Twist


Dogecoin Price Prediction: On November 18, the DOGE price witnessed a pivotal reversal from the resistance line of a symmetrical triangle pattern that has significantly influenced its price trajectory for nearly two years. This shift resulted in an 18% drop in Doge value, marking a weekly low of $0.0706. Can we expect this downward trend to persist?
Also Read: Dogecoin Whale Activity on the Rise, DOGE Price to $0.1?
Dogecoin Price Prediction: Triangle Pattern Govern Price Behaviour
- The rising DOGE price witnessed intense supply pressure around the $0.085 mark.
- The 50-day EMA slope continues to act as dynamic support
- The 24-hour trading volume in Dogecoin is $312 Million, indicating a 17% decrease.
 Source-Tradingview
Amidst a recent uptick in the cryptocurrency market, Dogecoin price found support at the psychologically significant level of $0.07. Over the past three days, buyers have recovered 10% of lost value, bringing it to $0.0777.
If this bullish momentum continues, we could see a further 10% increase, potentially challenging the upper trendline of the symmetrical triangle at around $0.085. Historically, each encounter with this trendline has led to a substantial drop, often retreating to the triangle’s lower trendline.
Hence, a potential clash at this level might incite substantial selling pressure, leading to a bearish reversal to the new emerging support trendline(black). A breach below this point could signal a more pronounced correction, possibly resulting in a 25% decline from the current trading price to reach the lower boundary.
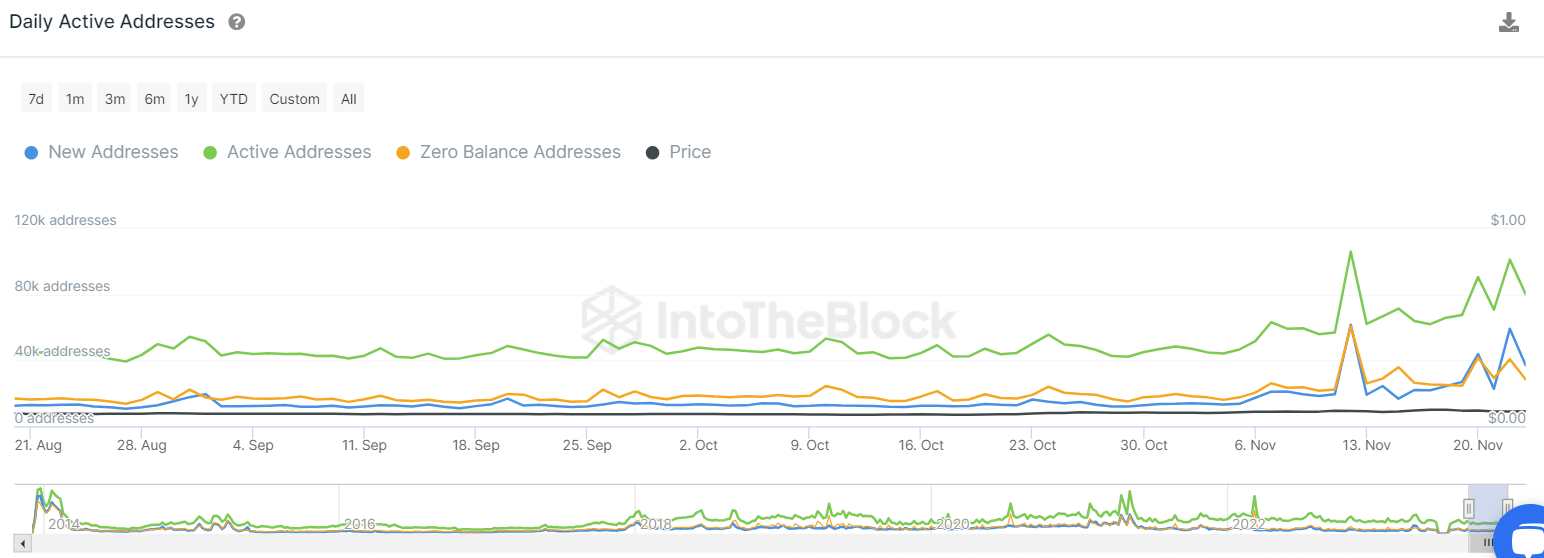
Growth In the Dogecoin Addresses
 Source- Intotheblock
This on-chain metric serves as an indicator of the network’s actual utilization and activity of users on the blockchain. This month has seen a notable uptick in the creation of new Dogecoin addresses and active user engagement, coinciding with the token’s price recovery. This surge in activity is likely spurred by recent developments, including the announcement of physical Dogecoin and Bitcoin tokens scheduled to be sent to the moon on December 23rd.
- Exponential Moving Averages: The coin price above the crucial EMAs(20, 50,100. and 200) day EMA, suggesting that the short-term recovery is in place.
- Relative Strength Index: The daily RSI around 54.69 reflects a neutral stance, however, the downward slope on the indicator, hints at a decrease in buying momentum.
Play 10,000+ Casino Games at BC Game with Ease
- Instant Deposits And Withdrawals
- Crypto Casino And Sports Betting
- Exclusive Bonuses And Rewards


Why Trust CoinGape
CoinGape has covered the cryptocurrency industry since 2017, aiming to provide informative insights Read more…to our readers. Our journal analysts bring years of experience in market analysis and blockchain technology to ensure factual accuracy and balanced reporting. By following our Editorial Policy, our writers verify every source, fact-check each story, rely on reputable sources, and attribute quotes and media correctly. We also follow a rigorous Review Methodology when evaluating exchanges and tools. From emerging blockchain projects and coin launches to industry events and technical developments, we cover all facets of the digital asset space with unwavering commitment to timely, relevant information.

Related Articles


- Breaking: Morgan Stanley Applies For Crypto-Focused National Trust Bank With OCC
- Ripple Could Gain Access to U.S. Banking System as OCC Expands Trust Bank Services
- $2T Barclays Explores Blockchain For Stablecoin Payments and Tokenized Deposits
- Breaking: U.S. PPI Inflation Rises To 2.9%, BTC Price Falls
- XRP News: Ripple-Backed Ctrl Alt Completes $280M in Diamond Tokenization on XRPL
- Top Analyst Predicts Pi Network Price Bottom, Flags Key Catalysts
- Will Ethereum Price Hold $1,900 Level After Five Weeks of $563M ETF Selling?
- Top 2 Price Predictions Ethereum and Solana Ahead of March 1 Clarity Act Stablecoin Deadline
- Pi Network Price Prediction Ahead of Protocol Upgrades Deadline on March 1
- XRP Price Outlook As Jane Street Lawsuit Sparks Shift in Morning Sell-Off Trend
- Dogecoin, Cardano, and Chainlink Price Prediction As Crypto Market Rebounds


