 Buy $GGs
Dogecoin Price Prediction: Will $0.055 Act as a Springboard for Next Recovery?


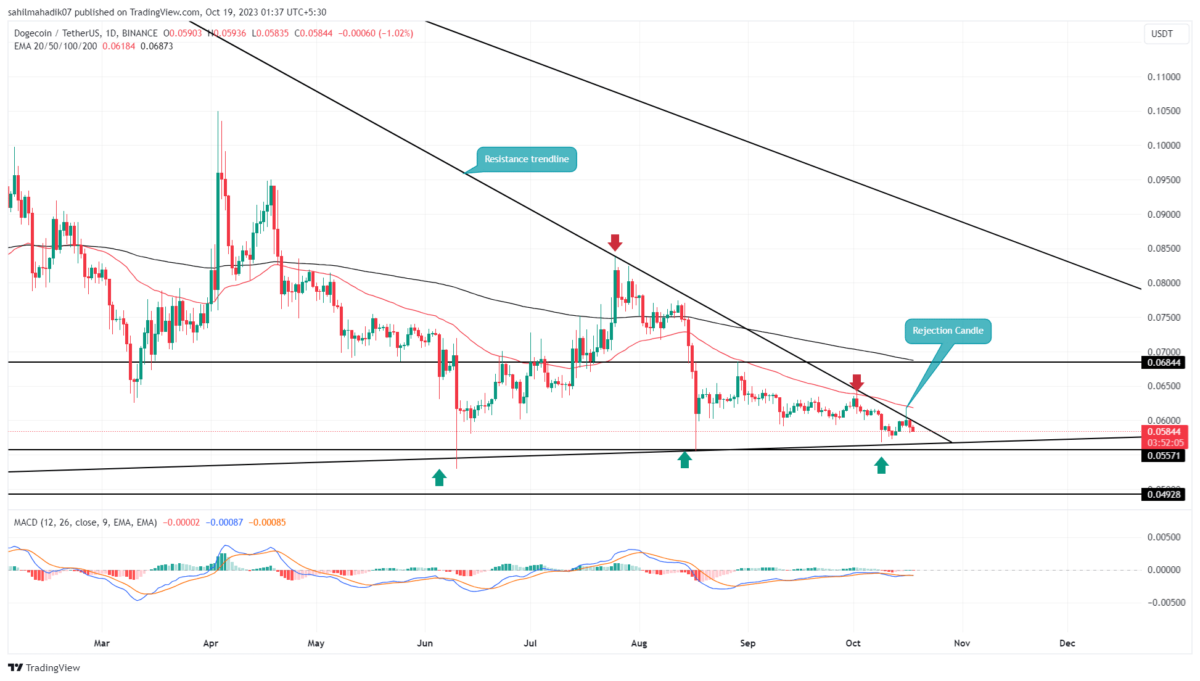
Amid a recent surge in the broader crypto market, the DOGE price attempted a notable breakout from a year-long, downward-sloping trendline that has been guiding its correction. However, the failure to maintain levels above this breached barrier led to a price reversal, indicating that overhead supply pressure remains strong, as does the ongoing correction.
Also Read: Shiba Inu And Dogecoin Get Listed On BitTrade, Price To Rally?
Will the Recovery Trend Continue?
- The Dogecoin price getting squeezed into a narrow range could lead to a decisive breakout
- An upside breakout from the resistance trendline could trigger a fresh rally
- The 24-hour trading volume in Dogecoin is $113 Million, indicating a 30% loss.
 Source-Tradingview
On October 16th, the Dogecoin price experienced its fifth rejection from a long-standing resistance trendline. The daily candle that formed during this failed breakout exhibited a high wick, suggesting an aggressive overhead supply.
Historically, reversals following such patterns have often resulted in significant corrections. Consequently, the DOGE price has been on a downturn for the past two days, registering a 2.5% decline.
If the selling pressure persists, the coin price is likely to drop an additional 4-5%, potentially retesting the yearly support trendline at around $0.055. Currently, this memecoin’s price is wedged between these two significant trendlines, signaling that a decisive breakout—or breakdown—is imminent.
If the coin manages to sustain a breakout above the resistance trendline, we could witness a sharp 16.8% surge, targeting the $0.068 level
Will DOGE Price Sustain $0.055 Support?
On the daily time frame chart, an ascending support trendline has cushioned Dogecoin buyers during significant market downturns over the past 2.5 years. This support level has acted as a strong accumulation zone, thereby shielding coin holders from major market dips. A reversal or breakdown from this crucial level warrants close attention from investors. Taking a pessimistic view, a breach below this support could catalyze a major correction for Dogecoin.
Play 10,000+ Casino Games at BC Game with Ease
- Instant Deposits And Withdrawals
- Crypto Casino And Sports Betting
- Exclusive Bonuses And Rewards


Why Trust CoinGape
CoinGape has covered the cryptocurrency industry since 2017, aiming to provide informative insights Read more…to our readers. Our journal analysts bring years of experience in market analysis and blockchain technology to ensure factual accuracy and balanced reporting. By following our Editorial Policy, our writers verify every source, fact-check each story, rely on reputable sources, and attribute quotes and media correctly. We also follow a rigorous Review Methodology when evaluating exchanges and tools. From emerging blockchain projects and coin launches to industry events and technical developments, we cover all facets of the digital asset space with unwavering commitment to timely, relevant information.

Related Articles


- Vitalik Buterin Maps Out Quantum Risks as Ethereum Foundation Unveils ‘Strawmap’
- BlackRock Adds $289M in BTC as Bitcoin ETFs Log 2-Week High Inflows Of $500M
- Glassnode Signals Bitcoin Still Faces Downside Risk Amid Massive Sell Pressure at $70K
- U.S House Introduces Bipartisan Crypto Bill To Protect Crypto Developers Amid DeFi Push Under CLARITY Act
- XRP News: Ripple Unveils Funding Hub To Support Innovation On XRPL
- Top 2 Price Predictions Ethereum and Solana Ahead of March 1 Clarity Act Stablecoin Deadline
- Pi Network Price Prediction Ahead of Protocol Upgrades Deadline on March 1
- XRP Price Outlook As Jane Street Lawsuit Sparks Shift in Morning Sell-Off Trend
- Dogecoin, Cardano, and Chainlink Price Prediction As Crypto Market Rebounds
- Will Solana Price Rally to $100 If Bitcoin Reclaims $72K?
- XRP Price Eye $2 Rebound as On-Chain Data Signals Massive Whale Accumulation


