 Buy $GGs
Dogecoin Price to Surpass $0.85? Bullish Pattern Set Stage for Recovery Rally


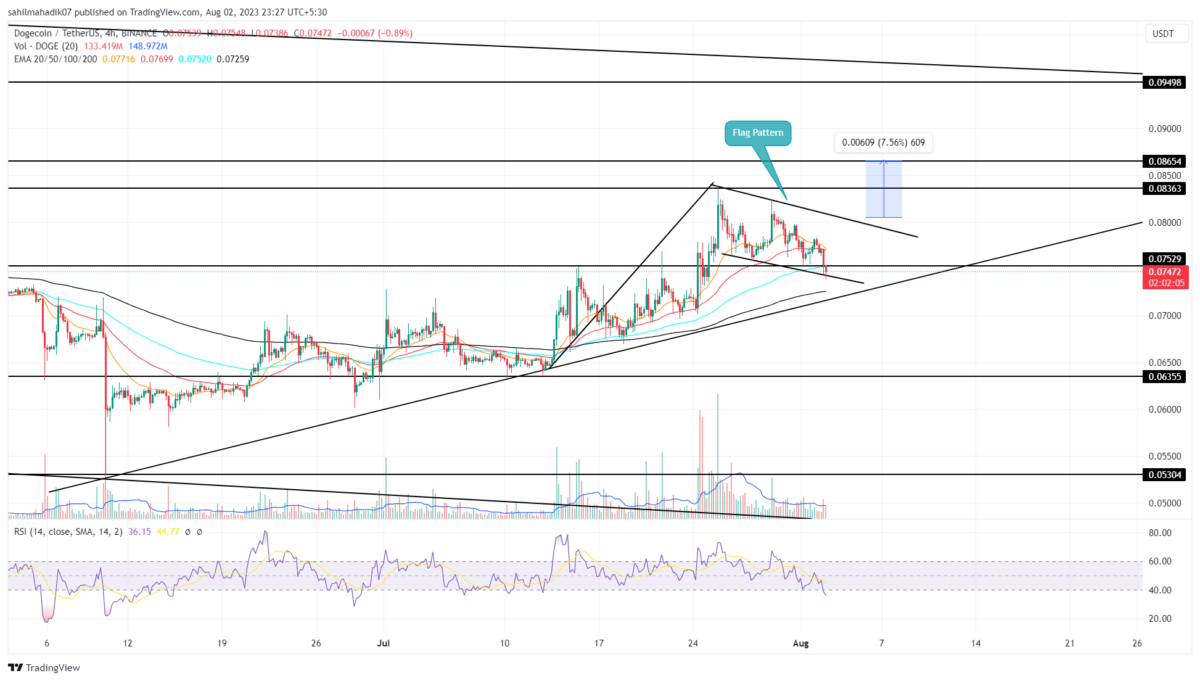
The crypto market has been under a bearish spell lately, resulting in a minor correction in the ongoing recovery rally of Dogecoin. Over the past week, popular memes experienced a drop from $0.083 to the current trading price of $0.075, registering a loss of 10.4%. However, this downward slide seems to be part of a bullish continuation pattern known as a ‘flag‘ when observed on the four-hour time frame chart. This pattern could potentially serve as a useful tool for traders looking to enter at a better price.
Also Read: Is Dogecoin Price Ready to Reclaim $0.1?
Dogecoin Price Daily Chart
- A bearish crossover between the 20 and 50 EMA hints at the continuation of ongoing correction
- The falling DOGE price could offer a pullback opportunity at a lower support trendline.
- The 24-hour trading volume in the Dogecoin coin is $383.5 Million, indicating a 31% gain.
 Source-Tradingview
Currently, the DOGE price is fluctuating within the flag pattern’s channel structure. The coin price has bounced thrice from the pattern’s support trendline and twice from the overhead resistance, reflecting its significant influence on traders. Flag patterns often signify a ‘breather’ after a significant price move and are usually followed by a continuation of the previous trend.
With a 4.6% intraday drop, the coin price retested the lower support trendline. A possible rebound from the aforementioned trendline could bolster buyers’ confidence to challenge the overhead resistance. Until this resistance is intact, the Dogecoin may prolong the retracement fall. However, if broken, it could potentially signal a strong buying momentum, prompting more traders to join the rally.
Should crypto buyers manage to break past this resistance, the coin price should rise 8%, allowing it to surpass the significant psychological barrier of $0.085.
Could DOGE Price Retrace its Steps Back to $0.635?
The Dogecoin price is currently following a recovery rally, significantly bolstered by the strength of a key support trendline. However, amid an ongoing correction phase, it appears that sellers are attempting to breach this crucial support. A successful breach could spark an acceleration of selling pressure, setting Dogecoin into a significant correction phase. Should this occur, the extended downfall could potentially send the prices tumbling down to $0.063, followed by $0.053.
Play 10,000+ Casino Games at BC Game with Ease
- Instant Deposits And Withdrawals
- Crypto Casino And Sports Betting
- Exclusive Bonuses And Rewards


Why Trust CoinGape
CoinGape has covered the cryptocurrency industry since 2017, aiming to provide informative insights Read more…to our readers. Our journal analysts bring years of experience in market analysis and blockchain technology to ensure factual accuracy and balanced reporting. By following our Editorial Policy, our writers verify every source, fact-check each story, rely on reputable sources, and attribute quotes and media correctly. We also follow a rigorous Review Methodology when evaluating exchanges and tools. From emerging blockchain projects and coin launches to industry events and technical developments, we cover all facets of the digital asset space with unwavering commitment to timely, relevant information.

Related Articles


- Is the Bitcoin Price Correction Really Over or Is This a Bear Market Trap?
- ‘Gambling Is Not Investing’: New Group Pushes Crackdown on Prediction Markets
- XRP News: Ripple Prime to Move Post-Trade Activity to XRPL via NSCC Link
- Fed Rate Cut at Risk: Janet Yellen Flags Inflation Concerns Amid US-Iran War
- Senate Eyes CLARITY Act Markup This Month as Banks, Crypto Continue Stablecoin Yield Talks
- Top 5 Historical Reasons Dogecoin Price Is Not Rising
- Pi Coin Price Prediction for March 2026 Amid Network Upgrade, KYC Boost, Rewards Distribution
- Gold Price Nears ATH; Silver Eyes $100 Breakout on Us- Iran War
- Bitcoin And XRP Price As US Kills Iran Supreme Leader- Is A Crypto Crash Ahead?
- Gold Price Prediction 2026: Analysts Expect Gold to Reach $6,300 This Year
- Circle (CRCL) Stock Price Prediction as Today is the CLARITY Act Deadline


