Downtrend Exhausted? Here’s Why DOGE Price May Have Bottomed at $0.055


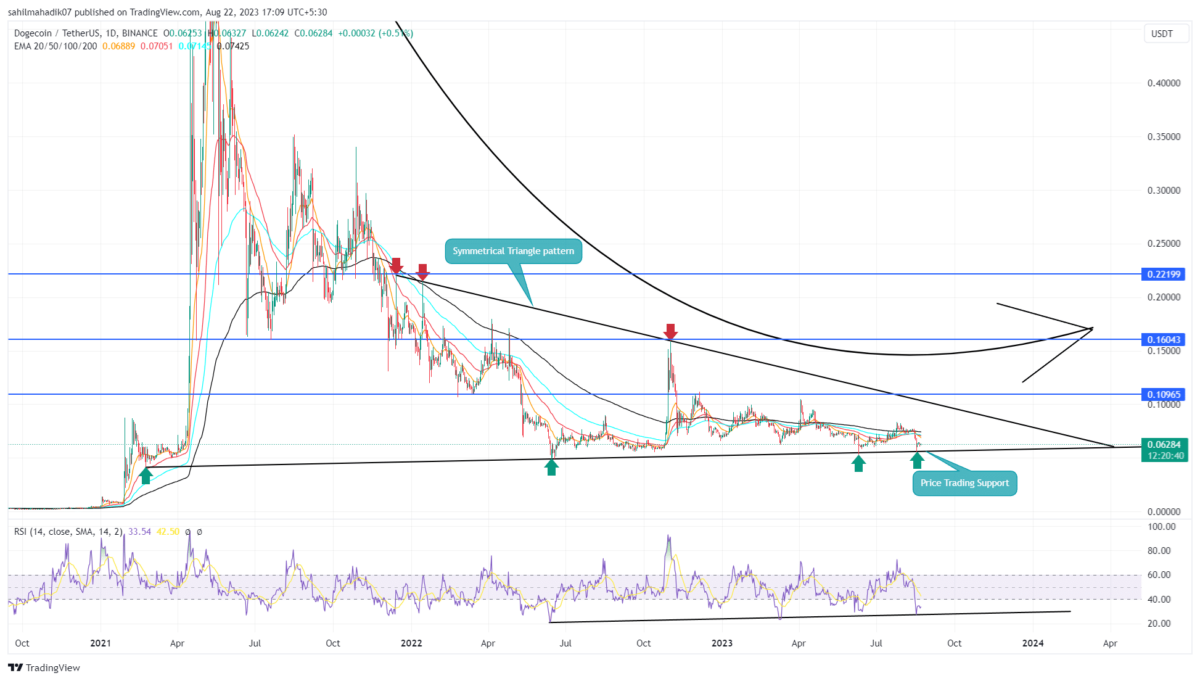
In the daily time frame chart, Dogecoin shows an evident shift of a downward trend to sideways. Such price behavior reflects exhausted bearish momentum which leads to bottoming of a downtrend. This long-term consolidation can be marked by two converging trendlines also indicating the formation of the symmetrical triangle pattern. Here’s how this pattern can influence this Dog-themed memecoin.
Also Read: Dogecoin Developer Threatens to Quit if Switch to PoS is Conceived
Dogecoin Daily Chart: Key Points
- A symmetrical triangle pattern governs the current correction in Dogecoin
- A bullish reversal from the lower support trendline will set the coin price for a 50% upswing
- The 24-hour trading volume in the Dogecoin coin is $239.5 Million, indicating a 1.46% gain
 Source-Tradingview
For nearly two years, the Dogecoin price has been traveling a sideway trendline under the influence of a symmetrical triangle pattern. During this period, the coin price has rebounded four times from the lower trendline and thrice from the upper trendline indicating its impact on market participants.
Amid the July-August correction in the crypto market, the DOGE price plunged back to the pattern’s bottom trendline. For a long time, the dynamic support has recuperated bullish momentum and led to a strong bounce back in prices.
Thus, the traders bullish on Dogecoin can accumulate at this support and wait for an overhead trendline breakout for better confirmation of trend change. A bullish breakout from the upper trendline will intensify the bullish momentum and could lead the price rally to $0.11, followed by $0.16, and $0.221.
[converter id=”doge-dogecoin” url=”https://coingape.com/price/converter/doge-to-usd/?amount=1″]
Can Dogecoin Prolong Existing Correction?
While the overall price behavior currently favors Dogecoin buyers, the coin price remains in a sideways trend until the two trendlines are intact. Usually, the asset price gradually narrows within the chart pattern and gives a decisive breakout once it’s near the peak of the triangle. However, a bearish breakdown from the pattern’s lower trendline will set the DOGE price for a massive correction.
- Exponential moving average: The flattish daily EMAs (20, 50, 100, and 200) also accentuate a sideways trend in DOGE price.
- Relative Strength Index: The daily RSI(31) at an oversold region reflects a high probability of bullish reversal.

Why Trust CoinGape
CoinGape has covered the cryptocurrency industry since 2017, aiming to provide informative insights Read more…to our readers. Our journal analysts bring years of experience in market analysis and blockchain technology to ensure factual accuracy and balanced reporting. By following our Editorial Policy, our writers verify every source, fact-check each story, rely on reputable sources, and attribute quotes and media correctly. We also follow a rigorous Review Methodology when evaluating exchanges and tools. From emerging blockchain projects and coin launches to industry events and technical developments, we cover all facets of the digital asset space with unwavering commitment to timely, relevant information.

Related Articles


- Bitcoin vs Gold Feb 2026: Which Asset Could Spike Next?
- Top 3 Reasons Why Crypto Market is Down Today (Feb. 22)
- Michael Saylor Hints at Another Strategy BTC Buy as Bitcoin Drops Below $68K
- Expert Says Bitcoin Now in ‘Stage 4’ Bear Market Phase, Warns BTC May Hit 35K to 45K Zone
- Bitcoin Price Today As Bulls Defend $65K–$66K Zone Amid Geopolitics and Tariffs Tensions
- COIN Stock Price Prediction: Will Coinbase Crash or Rally in Feb 2026?
- Shiba Inu Price Feb 2026: Will SHIB Rise Soon?
- Pi Network Price Prediction: How High Can Pi Coin Go?
- Dogecoin Price Prediction Feb 2026: Will DOGE Break $0.20 This month?
- XRP Price Prediction As SBI Introduces Tokenized Bonds With Crypto Rewards
- Ethereum Price Rises After SCOTUS Ruling: Here’s Why a Drop to $1,500 is Possible


