 Buy $GGs
EOS Price Looks For A Reversal Near This Critical Level


EOS price analysis indicates a downside momentum for the day. The price is crawling in a very narrow trading range with a mild negative bias. We expect the price to make a swift recovery from the current levels. As the price corrected nearly from its swing highs, this might be a bargain buying opportunity for the new entrants.
- EOS price trades lower for the fifth straight session.
- A reversal is expected as the price took a breather near $1.50.
- Momentum oscillators warn of aggressive bids.
As of publication time, EOS/USD is exchanging hands at $1.52, down 1.94% for the day. The trading volume fell 37% to $4.89 in the last 24 hours according to CoinMarketCap data.
EOS price looks for trend reversal
EOS price analysis on the daily chart revealed a trend reversal might be in the offering.
The price has formed a Doji candlestick in today’s session, following a big sell-off in the last trading day. Now, if the next day’s candlestick is a green one, then it would be a confirmation of a ‘bullish hammer’ pattern.
A hammer is a reversal pattern, generally formed at the end of either uptrend or a downtrend.
The sellers seem to be exhausted as the price took a swift recovery after testing the low of $1.47, testing it twice on the hourly chart. A spike in the buying order in the last one hour makes bulls hopeful.
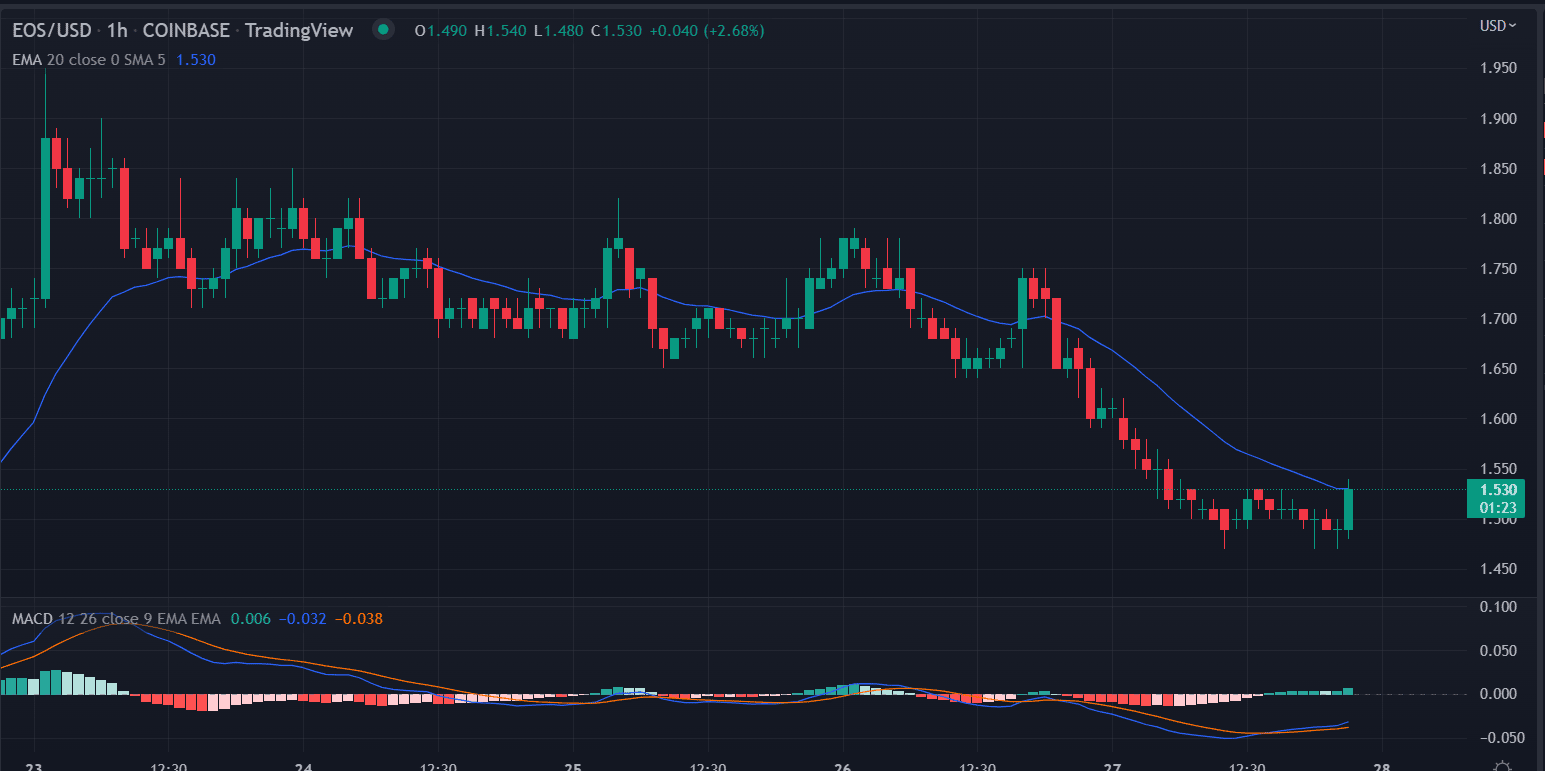
A big green candle points at the renewed buying pressure. The price attempts to breach the 20-day exponential moving average at $1.53.
An hourly closing above the mentioned level would see $1.60 followed by the high of the previous session at $1.79.
The moving average convergence divergence (MACD) trades below the mid-line but with a bullish crossover. If it moved above the zero line more gains could be predicted.
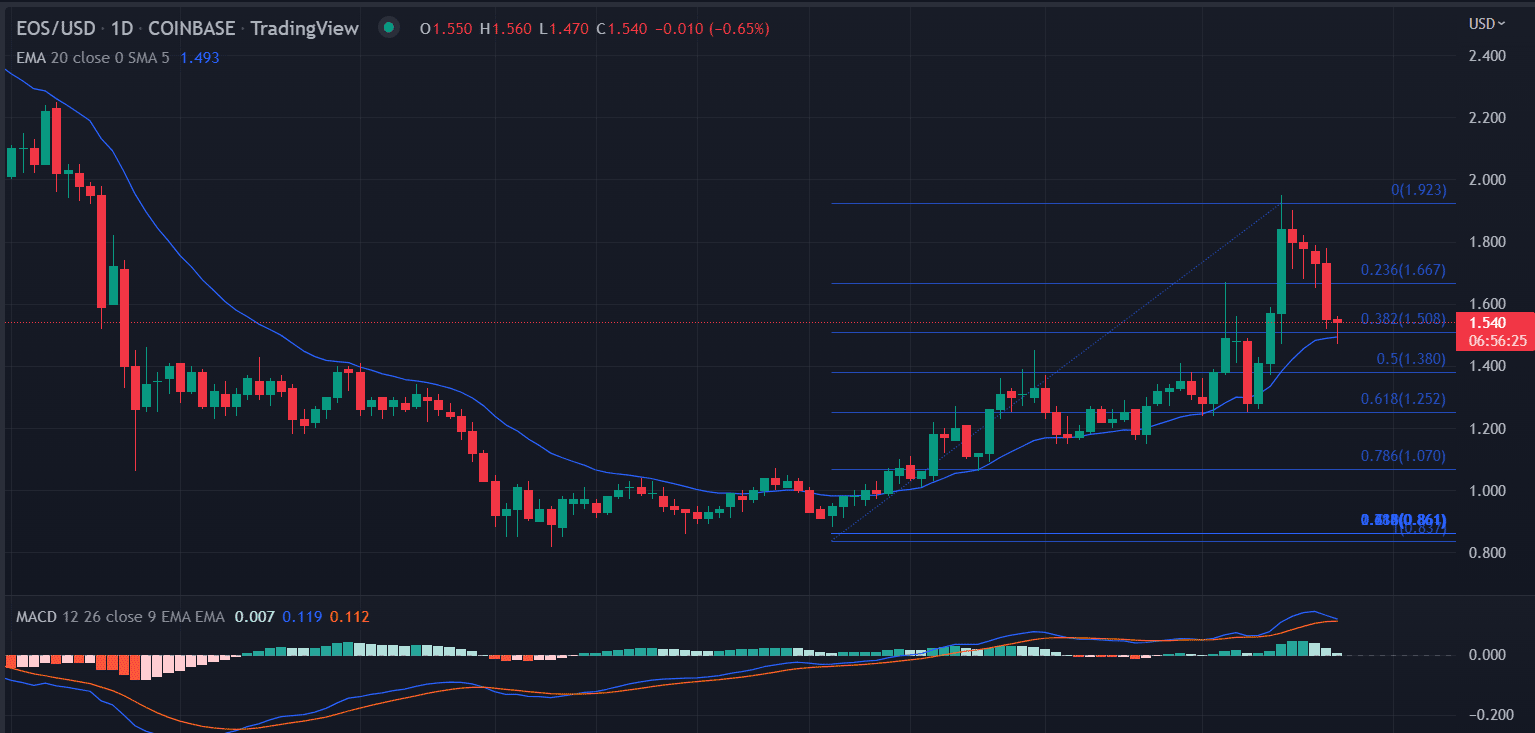
On the daily time frame, the EOS price is taking support at the 20-day ema. This also coincides with the 0.38% Fibonacci retracement level. The Fibonacci retracement extends from the lows of $0.88.A long position could be initiated if the price gave closing above $1.55 on the daily basis. Next, the bulls could aim for an August 17 high at $1.67.
The MACD holds above the central line with a neutral bias.
On the flip side, a spike in the sell order could violate the bullish theory. A break of the support area of $1.47 could extend the losses toward the 0.50% Fibonacci retracement at $1.40.
Also read: https://Coinbase Launches New Token, Will It Ease Sanctions Uncertainty
In conclusion, the price looks mildly bullish, a trade above $1.55 should be confirmed for the buy side.
Play 10,000+ Casino Games at BC Game with Ease
- Instant Deposits And Withdrawals
- Crypto Casino And Sports Betting
- Exclusive Bonuses And Rewards


Why Trust CoinGape
CoinGape has covered the cryptocurrency industry since 2017, aiming to provide informative insights Read more…to our readers. Our journal analysts bring years of experience in market analysis and blockchain technology to ensure factual accuracy and balanced reporting. By following our Editorial Policy, our writers verify every source, fact-check each story, rely on reputable sources, and attribute quotes and media correctly. We also follow a rigorous Review Methodology when evaluating exchanges and tools. From emerging blockchain projects and coin launches to industry events and technical developments, we cover all facets of the digital asset space with unwavering commitment to timely, relevant information.

Related Articles


- ‘Iran Will Not Surrender’: Crypto Market Falls Again as US–Iran Tensions Rise
- Fed Vice Chair Michelle Bowman Calls for More Rate Cuts as U.S. Labor Data Disappoints
- CLARITY Act Likely to Pass by July, Says Kristin Smith
- Best Cross-Chain Swap Platforms in 2026 – Top 9 Picks Reviewed
- Crypto Traders Predict Oil Prices to Rally Above $100 as Iran War Enters Week 2
- Here’s Why Cardano Price Has Not Reclaimed $0.30
- Will XRP Price Crash as U.S. Nonfarm Payrolls Fell by 92,000 in February?
- Pi Network Price Eyes a 40% Surge as Pi Day Looms on March 14
- Top Reasons Why Circle Stock Price is Surging
- Gold Price Prediction as US-Iran War Hits the Second Week
- HOOD Stock Targets $100 as Robinhood Unveils Platinum Card and Advance Dividend Feature


