 Buy $GGs
ETH Price Analysis: Rectangle Pattern Points to 8% Jump in Coming Week


After the August 17th bloodbath, the Ethereum price went sideways above the $1600 psychological. For the past ten days, the daily chart has showcased multiple candles with long wicks and tails reflecting uncertainty among market participants. However, a consolidation following a major drop usually reflects a short breather for sellers as they continue the downward projection in the near term.
Also Read: OnlyFans Invests in Ethereum as Revenue Tops $1 Billion
Ethereum Daily Chart: Key Points
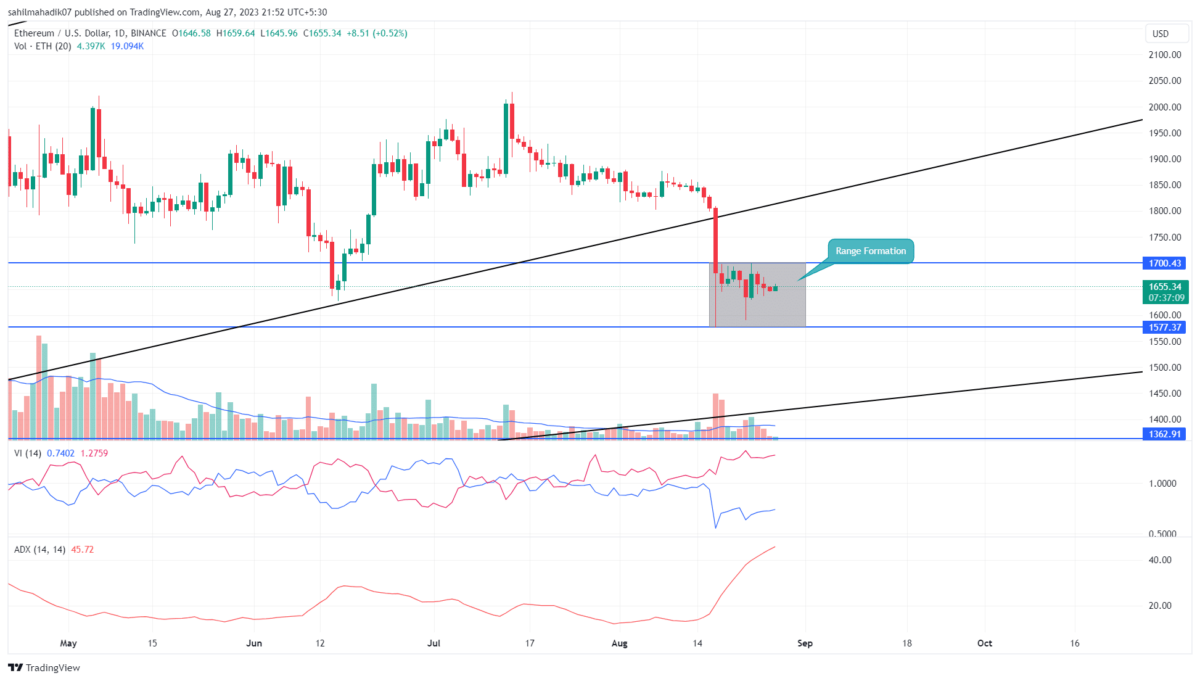
- The ETH price may prolong the consolidation phase until the range boundaries of $1700 and $1577 are intact.
- A bullish breakout from the $1700 barrier would trigger an 8% jump in price
- The intraday trading volume in Ether is $2.5 Billion, indicating a 22% loss.
 Source- Tradingview
The daily time frame chart projects the ongoing consolidation in ETH price is confined between two horizontal levels of $1700 and $1577. This narrow range/rectange pattern reflecting no initiation from market participants can be marked as a no-trading zone, but its boundaries can be used to foretell the near future trend.
Currently, the Ethereum price trades at $1656, and with an intraday gain of 0.6, it’s heading back to the overhead resistance of $1700. If the bullish momentum rises, the coin buyers can break this psychological resistance to trigger a longer pullback in the prevailing downtrend.
The post-breakout rally could surge the price 6% higher to retest the breached support trendline as potential resistance. This flipped barrier could assist sellers in recuperating selling momentum and set the Ethereum price back on the correction track.
On a contrary note, if the anticipated pullback breaks above $1800, the sellers may start losing grip over the Ethereum coin.
[converter id=”eth-ethereum” url=”https://coingape.com/price/converter/eth-to-usd/?amount=1″]
Can ETH Price Fall Back to $1450?
Concerning the uncertainty and bearishness in the top two leading cryptocurrencies Bitcoin and Ethereum, the crypto sellers may have an upper and therefore, a higher possibility of a $1577 breakdown. Losing this support will instantly prolong the correction trend and plunge the altcoin value 8.5% down to $1450.
- Average Directional Index: The daily ADX slope at 41% reflects the correction that could be reaching maturity and therefore supports the potential pullback.
- Vortex Indicator: A wide gap between the VI+(blue) and VI-(orange) in a bearish alignment reflects the overall market trend remains negative.
Play 10,000+ Casino Games at BC Game with Ease
- Instant Deposits And Withdrawals
- Crypto Casino And Sports Betting
- Exclusive Bonuses And Rewards


Why Trust CoinGape
CoinGape has covered the cryptocurrency industry since 2017, aiming to provide informative insights Read more…to our readers. Our journal analysts bring years of experience in market analysis and blockchain technology to ensure factual accuracy and balanced reporting. By following our Editorial Policy, our writers verify every source, fact-check each story, rely on reputable sources, and attribute quotes and media correctly. We also follow a rigorous Review Methodology when evaluating exchanges and tools. From emerging blockchain projects and coin launches to industry events and technical developments, we cover all facets of the digital asset space with unwavering commitment to timely, relevant information.

Related Articles


- US-Iran War: Reports Confirm Bombings In UAE, Bahrain and Kuwait As Crypto Market Makes Recovery
- XRP Price Dips on US-Iran Conflict, But Capitulation Signals March Rebound
- Crypto Market at Risk as U.S.–Iran War Threatens Inflation With Oil Price Surge
- Polymarket U.S.–Iran Strike Bets Fuel Insider Trading Speculation as Crypto Traders Net $1.2M
- Cardano’s DeFi TVL Climbs as USDCx Stablecoin Launches on Network
- Circle (CRCL) Stock Price Prediction as Today is the CLARITY Act Deadline
- Analysts Predict Where XRP Price Could Close This Week – March 2026
- Top Analyst Predicts Pi Network Price Bottom, Flags Key Catalysts
- Will Ethereum Price Hold $1,900 Level After Five Weeks of $563M ETF Selling?
- Top 2 Price Predictions Ethereum and Solana Ahead of March 1 Clarity Act Stablecoin Deadline
- Pi Network Price Prediction Ahead of Protocol Upgrades Deadline on March 1


