
ETH Price Breaks 75 Days Resistance; Is $1800 on the Horizon?


With the leading cryptocurrency Bitcoin rebounding from the $26000 psychological support, the ETH price witnessed an increase in buying pressure. This second-largest crypto coin has been rising for five consecutive days and recorded a 5.5% gain. Amid this rally, the coin price breached a two-month-long resistance trendline as a signal of trend reversal.
Also Read: Ethereum Price Prediction As The SEC Delays Decisions On ETFs From Ark, VanEck
Is ETH Price Heading to $1800?
- The breached resistance trendline carried the recent correction trend in the Ethereum coin.
- Crypto buyers may face high demand pressure at $1775 resistance
- The intraday trading volume in Ether is $6.1 Billion, indicating a 2.6% loss
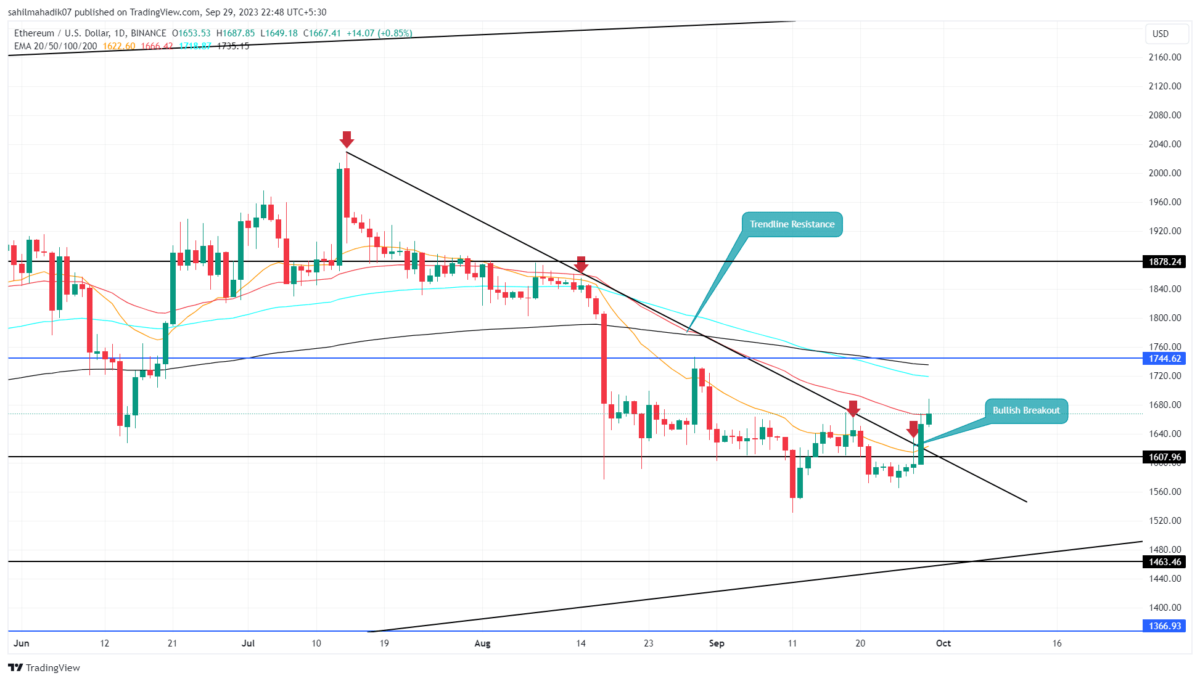
 Source- Tradingview
Since mid-July, the Ethereum price has been on a downward spiral, plummeting from a high of $2,028 to its current trading level of $1,578—a loss of approximately 21.63%. This descending trajectory is reinforced by a downward-sloping trendline, which has repeatedly repelled bullish attempts to break above it.
The daily chart illustrates four instances where the price has been rejected by this trendline, highlighting the aggressive defense from sellers. Yesterday, the ETH price saw an inflow of buying pressure, leading to a decisive break from this overhanging resistance.
By the press time, this altcoin trades at $1667 with an intraday gain of 0.84%. If the coin price manages to sustain this breakout, the buyers may use this level as a potential support to lead further rallies.
If the bullish sentiment persists, the ETH price may rise 4.7% to hit the immediate resistance at $1745, followed by $1878.
[converter id=”eth-ethereum” url=”https://coingape.com/price/ethereum/”]
Is Ongoing Recovery Sustainable?
Looking at the bigger picture, the ETH price has been carrying a recovery trend using a long-standing support trendline. The daily chart reveals that this trendline has been holding up since June 2022 and could offer a dip-buying opportunity during significant price drops. If renewed buying pressure accumulates at this support level, it could provide the bulls with the necessary momentum to breach the overhead trendline and aim for a recovery above the $1,800 mark.
Play 10,000+ Casino Games at BC Game with Ease
- Instant Deposits And Withdrawals
- Crypto Casino And Sports Betting
- Exclusive Bonuses And Rewards


Why Trust CoinGape
CoinGape has covered the cryptocurrency industry since 2017, aiming to provide informative insights Read more…to our readers. Our journal analysts bring years of experience in market analysis and blockchain technology to ensure factual accuracy and balanced reporting. By following our Editorial Policy, our writers verify every source, fact-check each story, rely on reputable sources, and attribute quotes and media correctly. We also follow a rigorous Review Methodology when evaluating exchanges and tools. From emerging blockchain projects and coin launches to industry events and technical developments, we cover all facets of the digital asset space with unwavering commitment to timely, relevant information.
24 Hours volume
$25.12B
Market Cap
$274.96B
Max Supply
NA


- Ethereum Targets $4K as Peter Brandt Flags Potential ETH Bottom
- PrimeXBT: Bitcoin tests February highs as Iran partially reopens the Strait of Hormuz; key levels to watch
- Meme Coins Rally: Why DOGE, SHIB, PEPE and BONK Price are Soaring?
- Breaking: Michael Saylor’s Strategy Makes Largest Bitcoin Buy This Year as MSTR Stock Rallies
- Breaking: Metaplanet Raises $531M, Revises Bitcoin Capital Allocation Policy
- Pepe Coin Price Surges 20%- How High Can it Go in March?
- Is XRP Price Gearing Up For $2 Level As BTC Rebounds Above $74k?
- Cardano’s $0.50 Resistance- Can “Midnight” Alpha Defy the Fog of War?
- Bitcoin and XRP Price Outlook If the Senate Banking Committee Approves the CLARITY Act
- Official Trump Price Prediction As TRUMP Token Soars 50% Ahead Mar-a-Lago Invite Buzz for Top Holders
- Solana vs XRP Price Forecast: Can SOL Reclaim Its All-Time High Before XRP Hits $2?


