ETH Price Hints Major Correction Ahead If Buyers Lose $1620 Support


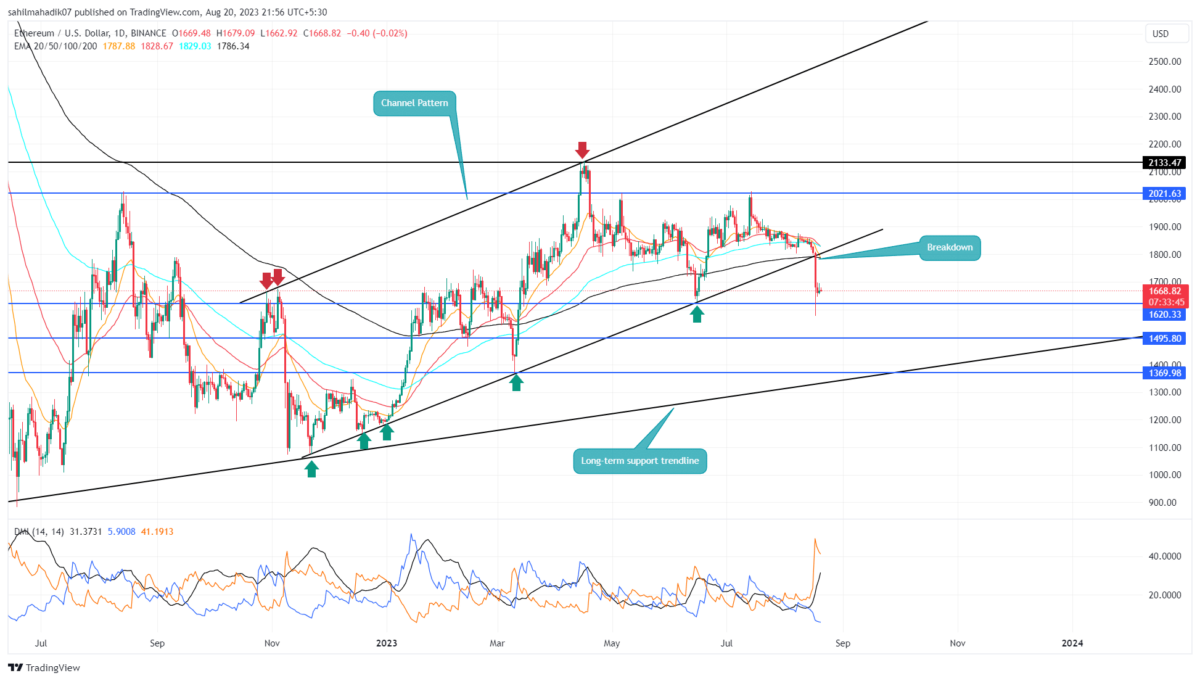
The Ethereum coin initiated its ongoing correction mode when the price turned down from the $2020 barrier. Within the last five weeks, the coin price tumbled 17.5% and reached the current trading price of $1669. Amid this down the sellers break down from a support trendline of channel pattern indicating the second largest cryptocurrency may face further correction.
Also Read: Ethereum Devs Share Holesky Updates; When ETH Price Rally?
Ethereum Daily Chart: Key Points
- A breakdown below $1620 will violate the dow theory of uptrend and intensify the selling momentum.
- The wide fap between DI+ and DI- slopes of the directional moving average reflects bearish momentum aggressively.
- The intraday trading volume in Ether is $4.6 Billion, indicating a 20% loss.
 Source- Tradingview
On August 17th, the Ethereum coin showcased a massive breakdown from the rising channel pattern. This chart setup carried a sustained uptrend for nearly nine months, offering an excellent opportunity to accumulate at dips.
However, this breakdown may flip the market sentiment into a sell-on bounce providing an opportunity to short-sell. By press time, the ETH price trades at $1671 with an intraday gain of 0.13%.
Usually, a massive downfall is followed by a minor pullback to recuperate bullish momentum. However, the coin price trading sideways reflects the selling momentum is still aggressive which could lead to a breakdown below $1620.
The post-breakdown fall may lead the altcoin to $1495, followed by $1370.
[converter id=”eth-ethereum” url=”https://coingape.com/price/converter/eth-to-usd/?amount=1″]
Can ETH Price Reclaim Higher Grounds?
In case the Ethereum buyers rebounded from the $1620 support, the price trend may surge by 7% to retest the breached trendline of the channel. If the coin price sustained below this flipped support the coin holders may still be under correction threat.
For buyers to undermine this breakdown and kickstart a fresh recovery, the coin price should give a closing above the August 17th high of $1808.
- Exponential Moving Average: A bearish crossover between 20-and-200-day EMA could bolster selling in the market.
- Average Directional Index: the ADX slope at 31% hints the downward trend is approaching maturity.

Why Trust CoinGape
CoinGape has covered the cryptocurrency industry since 2017, aiming to provide informative insights Read more…to our readers. Our journal analysts bring years of experience in market analysis and blockchain technology to ensure factual accuracy and balanced reporting. By following our Editorial Policy, our writers verify every source, fact-check each story, rely on reputable sources, and attribute quotes and media correctly. We also follow a rigorous Review Methodology when evaluating exchanges and tools. From emerging blockchain projects and coin launches to industry events and technical developments, we cover all facets of the digital asset space with unwavering commitment to timely, relevant information.

Related Articles


- Bitcoin vs Gold Feb 2026: Which Asset Could Spike Next?
- Top 3 Reasons Why Crypto Market is Down Today (Feb. 22)
- Michael Saylor Hints at Another Strategy BTC Buy as Bitcoin Drops Below $68K
- Expert Says Bitcoin Now in ‘Stage 4’ Bear Market Phase, Warns BTC May Hit 35K to 45K Zone
- Bitcoin Price Today As Bulls Defend $65K–$66K Zone Amid Geopolitics and Tariffs Tensions
- COIN Stock Price Prediction: Will Coinbase Crash or Rally in Feb 2026?
- Shiba Inu Price Feb 2026: Will SHIB Rise Soon?
- Pi Network Price Prediction: How High Can Pi Coin Go?
- Dogecoin Price Prediction Feb 2026: Will DOGE Break $0.20 This month?
- XRP Price Prediction As SBI Introduces Tokenized Bonds With Crypto Rewards
- Ethereum Price Rises After SCOTUS Ruling: Here’s Why a Drop to $1,500 is Possible


