
Despite the Recent Drop Ethereum Price Holds $1,550; Should You Worry?


Ethereum price looks pessimistic to neutral in today’s session. ETH holds near the critical trading level which could be a make-or-break situation for the investors. After testing the highs of $1,686.82 in the previous session the bulls failed to capitalize on the gains.
As of publication time, ETH/USD is exchanging hands at $1,541.37, down 1.41% for the day. The second largest cryptocurrency by market cap holds the 24-hour trading volume at $19,882,271,155 with marginal gains.
It seems the range-bound movement is expected to continue and the investors are waiting for confirmation on the macro side of the economy. In a broader market, the superlative U.S dollar exerts pressure on cryptocurrencies.
- Ethereum price fell for the second straight day on Wednesday.
- A break below $1,500 could be a warning sign for ETH buyers.
- However, the formation of a Doji candlestick implies wait and watch approach before placing aggressive bids.
Ethereum price trades near crucial level
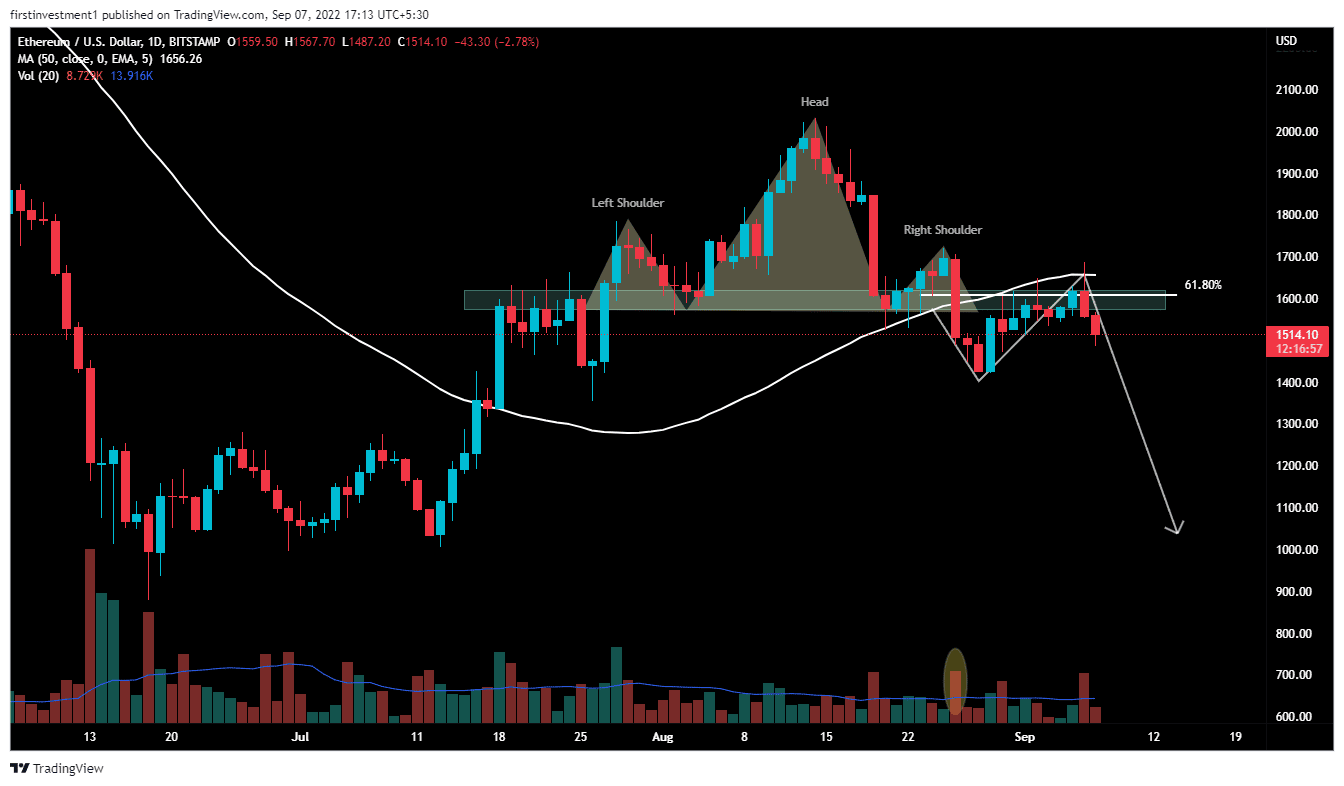
On the daily chart, the Ethereum price on August 26, gave a breakdown of a bearish “Head & Shoulder” Pattern, breaking down the neckline support, with rising volumes compared to previous average volumes.
The neckline of support is between $1,578 to $1,610. The price takes rejection on a pullback, and faces heavy resistance at 61.8% Fibonacci retracement, along with the 50-day exponential moving average.
Now, the neckline act as a resistance, which was earlier acted as a support. If the price sustains below $1,490, then there is a higher chance Ethereum bears could drag the price toward $1,330.
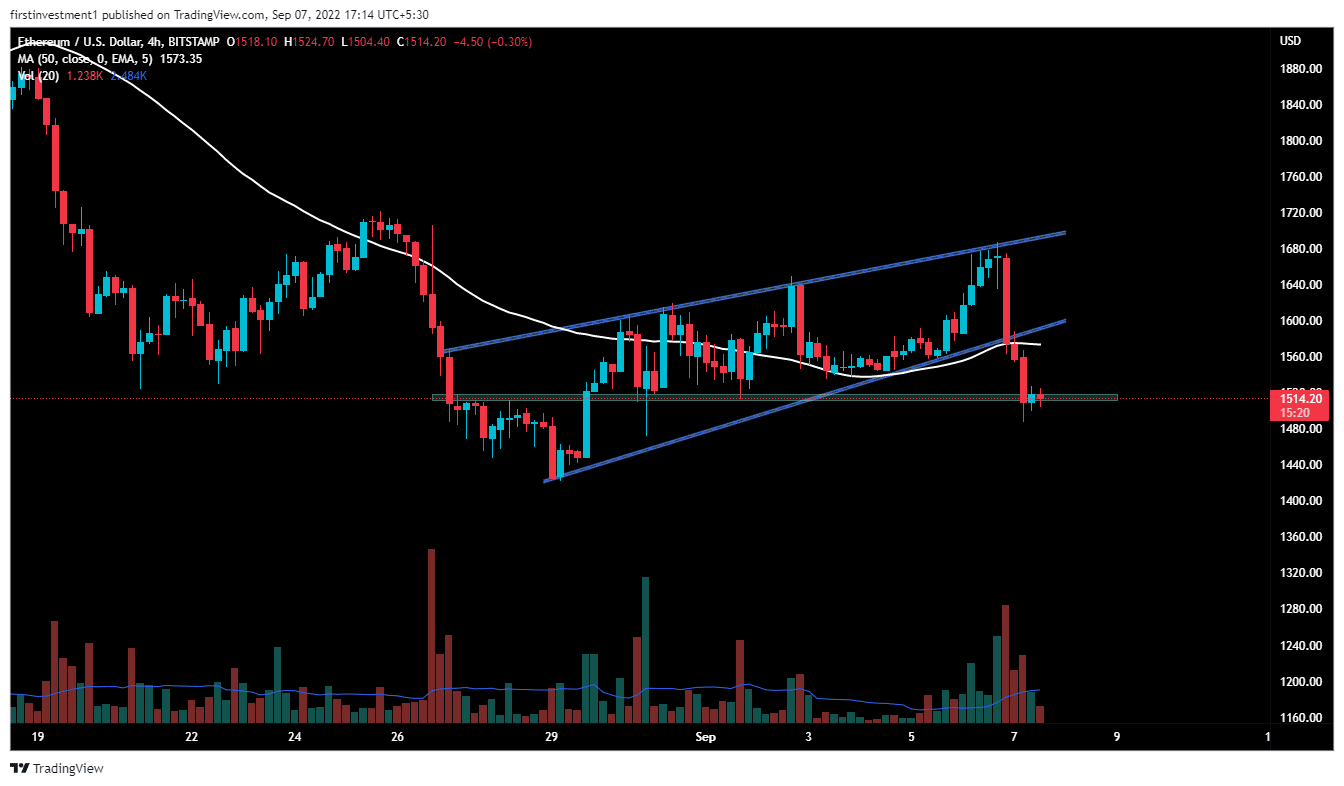
On the four hourly charts, Ethereum bears took the charge after the price gave a breakout of a “Rising Wedge” pattern. The rising wedge pattern is a bearish chart pattern that signals an imminent breakout to the downside. In this, the price action temporarily trades in an uptrend (the higher highs and higher lows). Two trend lines (support and resistance) are converging. The decrease in volume as the wedge progresses towards the breakout.
Currently, the price has taken support near $1,490, If this level broke with good volumes, then we can expect a fall of up to $1,330.
Also read: https://This Can Be Major Reason Behind Bitcoin Price Fall
The nearest support is $1,490, whereas the nearest resistance is $1,600. There is a higher probability of the price to breaks its support. “Sell on rising” opportunity is the best course of plan we can go with.
On the other hand, a spike in buying orders could result in invalidating of the bearish outlook, if the price closes above the $1,600 level. And the price can move higher toward $1,700.
Ethereum is bearish to neutral on all time frames. Below $1,490 closing on the hourly time frame, we can put a trade on the sell side.
Play 10,000+ Casino Games at BC Game with Ease
- Instant Deposits And Withdrawals
- Crypto Casino And Sports Betting
- Exclusive Bonuses And Rewards


Why Trust CoinGape
CoinGape has covered the cryptocurrency industry since 2017, aiming to provide informative insights Read more…to our readers. Our journal analysts bring years of experience in market analysis and blockchain technology to ensure factual accuracy and balanced reporting. By following our Editorial Policy, our writers verify every source, fact-check each story, rely on reputable sources, and attribute quotes and media correctly. We also follow a rigorous Review Methodology when evaluating exchanges and tools. From emerging blockchain projects and coin launches to industry events and technical developments, we cover all facets of the digital asset space with unwavering commitment to timely, relevant information.


- Michael Saylor Hints at Another Strategy Bitcoin Buy With ‘Stretch the Orange Dots’ Post
- Will CLARITY Act Pass in 2026? Galaxy’s Alex Thorn Warns April Deadline Is Critical
- Tom Lee’s Bitmine Adds 5,000 ETH Despite $7.5B Unrealized Loss as BMNR Stock Rebounds
- CLARITY Act Should Ban Stablecoin Yields to Advance in Senate, French Hill Says
- U.S. Set to Deploy Warships to Keep the Strait of Hormuz Open, Bitcoin Climbs
- Solana vs XRP Price Forecast: Can SOL Reclaim Its All-Time High Before XRP Hits $2?
- Top Analyst Predicts Cardano Price Could Surge 100% As Bitcoin Breaks $72k
- What’s Keeping Shiba Inu Below $0.0000065- Analyst Predicts 30% Rise Ahead
- BTC Price to $100K by 2026? Kalshi and Polymarket Odds Climb to 42%
- Why Pi Network Price Surged 30% Today?
- What Happens to XRP Price If US Wins War Against Iran?


