
Ethereum Price Charts Signal Buy The Dip Opportunity Ahead


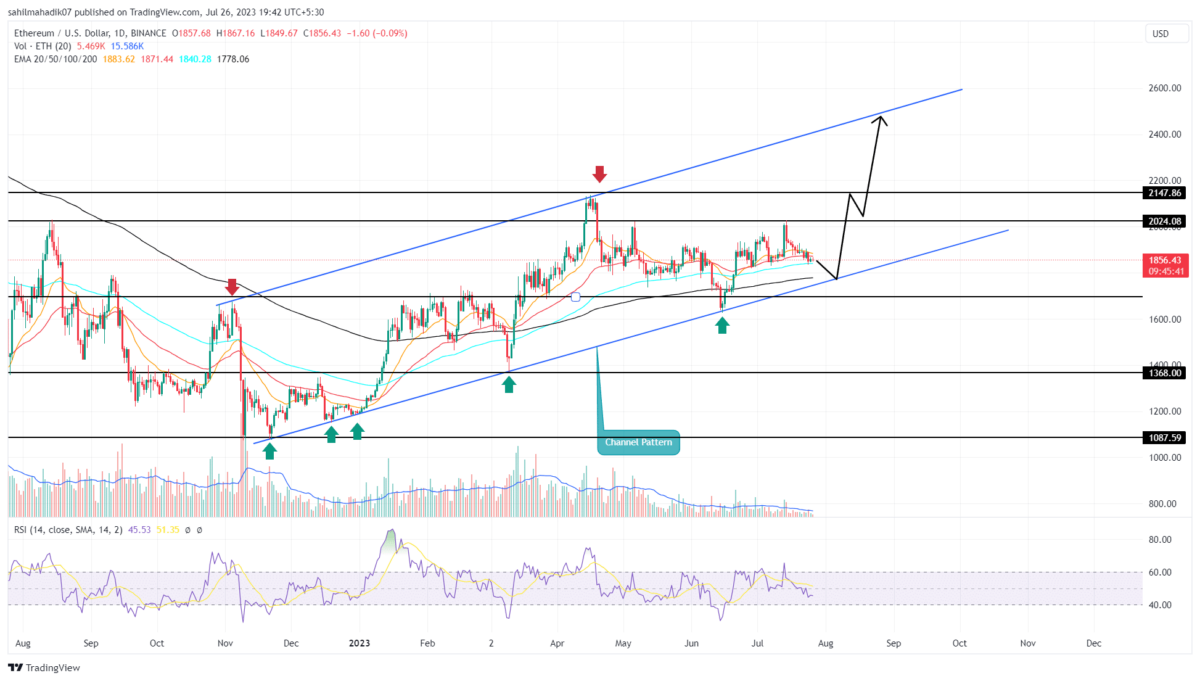
Over the past nine months, the Ethereum price has maintained a sustained uptrend under the influence of rising channel patterns. During this pattern formation, the coin price resonates between the two parallel trendlines, offering dynamic support and resistance to market traders.
The ETH price currently approaching the lower trendline hints the investor could get an opportunity to ride the next recovery cycle.
Also Read: US Fed Rate ‘Hike And Pause’ Price In: Bitcoin, Ethereum, XRP, DOGE Set For Rally
Ethereum Price Daily Chart
- The Ethereum holders can maintain a bullish outlook until the channel pattern is intact.
- A potential 5% drop offers an opportunity to accumulate this altcoin for long-term buying
- The intraday trading volume in Ether is $4.3 Billion, indicating a 10% loss.
 Source- Tradingview
With increasing bearishness in the crypto market, the Ethereum price has recently witnessed a sharp reversal from the $2000 psychological resistance. Within the last two weeks, the coin price 8.5% to reach the current trading price of $1856.
If the bearish momentum persists, the coin sellers may prolong the correction by another 4-5% and revisit the long-coming support trendline at $1800. Amid this pattern development, the ETH price has rebounded several times from the dynamic support, indicating a suitable platform for investors to accumulate the second-largest cryptocurrency.
If the altcoin price shows sustaining above the aforementioned trendline, the buyer could kickstart a new recovery cycle. In ideal conditions, a bullish reversal within the channel pattern carries an upswing to the overhead trendline, indicating the Ethereum price could surpass a $2138 swing high to reach the $2400 mark.
[converter id=”eth-ethereum” url=”https://coingape.com/price/converter/eth-to-usd/?amount=1″]
Will ETH Price Revisit $1600 Amid Market Correction?
Considering a pessimistic situation, a breakdown below the bottom support trendline with daily candle closing will invalidate the bullish thesis. Losing the dynamic support will hint at a major correction and potentially push this coin’s market value to $1628, followed by $1368.

Why Trust CoinGape
CoinGape has covered the cryptocurrency industry since 2017, aiming to provide informative insights Read more…to our readers. Our journal analysts bring years of experience in market analysis and blockchain technology to ensure factual accuracy and balanced reporting. By following our Editorial Policy, our writers verify every source, fact-check each story, rely on reputable sources, and attribute quotes and media correctly. We also follow a rigorous Review Methodology when evaluating exchanges and tools. From emerging blockchain projects and coin launches to industry events and technical developments, we cover all facets of the digital asset space with unwavering commitment to timely, relevant information.


